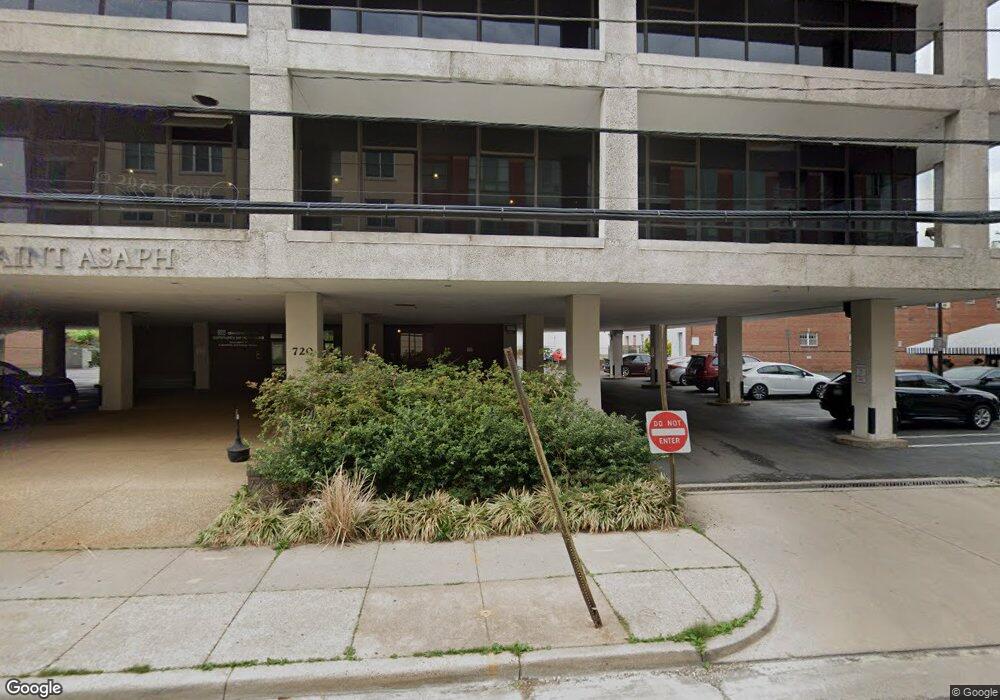
720 N Saint Asaph St Alexandria, VA 22314
Old Town NeighborhoodEstimated Value: $5,315,621
--
Bed
6
Baths
22,580
Sq Ft
$235/Sq Ft
Est. Value
About This Home
This home is located at 720 N Saint Asaph St, Alexandria, VA 22314 and is currently estimated at $5,315,621, approximately $235 per square foot. 720 N Saint Asaph St is a home located in Alexandria City with nearby schools including Jefferson-Houston Elementary School, Alexandria City High School, and Potomac Crescent Waldorf School.
Ownership History
Date
Name
Owned For
Owner Type
Purchase Details
Closed on
Feb 29, 2008
Sold by
720 Associates Llc
Bought by
Dfh Property Holdings Llc
Current Estimated Value
Home Financials for this Owner
Home Financials are based on the most recent Mortgage that was taken out on this home.
Original Mortgage
$1,200,000
Outstanding Balance
$746,779
Interest Rate
5.72%
Mortgage Type
Credit Line Revolving
Estimated Equity
$4,568,842
Purchase Details
Closed on
Nov 19, 1999
Sold by
Jack Effram
Bought by
Sheltered Homes Of Alexandria
Purchase Details
Closed on
Jul 16, 1999
Sold by
Paterson Michael L
Bought by
Sheltered Homes Of Alexandria
Create a Home Valuation Report for This Property
The Home Valuation Report is an in-depth analysis detailing your home's value as well as a comparison with similar homes in the area
Home Values in the Area
Average Home Value in this Area
Purchase History
| Date | Buyer | Sale Price | Title Company |
|---|---|---|---|
| Dfh Property Holdings Llc | $5,850,000 | -- | |
| Sheltered Homes Of Alexandria | $64,000 | -- | |
| Sheltered Homes Of Alexandria | $109,000 | -- |
Source: Public Records
Mortgage History
| Date | Status | Borrower | Loan Amount |
|---|---|---|---|
| Open | Dfh Property Holdings Llc | $1,200,000 |
Source: Public Records
Tax History Compared to Growth
Tax History
| Year | Tax Paid | Tax Assessment Tax Assessment Total Assessment is a certain percentage of the fair market value that is determined by local assessors to be the total taxable value of land and additions on the property. | Land | Improvement |
|---|---|---|---|---|
| 2025 | $60,849 | $5,000,000 | $5,000,000 | -- |
| 2024 | $60,849 | $5,166,000 | $1,791,160 | $3,374,840 |
| 2023 | $57,343 | $5,166,000 | $1,791,160 | $3,374,840 |
| 2022 | $56,754 | $5,113,000 | $1,791,160 | $3,321,840 |
| 2021 | $59,185 | $5,332,000 | $1,791,160 | $3,540,840 |
| 2020 | $61,232 | $5,332,000 | $1,791,160 | $3,540,840 |
| 2019 | $60,252 | $5,332,000 | $1,791,160 | $3,540,840 |
| 2018 | $59,223 | $5,241,000 | $1,791,160 | $3,449,840 |
| 2017 | $59,223 | $5,241,000 | $1,791,160 | $3,449,840 |
| 2016 | $55,099 | $5,135,000 | $1,791,160 | $3,343,840 |
| 2015 | $56,844 | $5,450,000 | $1,791,160 | $3,658,840 |
| 2014 | $56,416 | $5,409,000 | $1,791,160 | $3,617,840 |
Source: Public Records
Map
Nearby Homes
- 2 Bedroom + Den Plan at The Whitley
- 3 Bedroom Plan at The Whitley
- 2 Bedroom Plan at The Whitley
- 1 Bedroom + Den Plan at The Whitley
- 1 Bedroom Plan at The Whitley
- 811 N Columbus St Unit 508
- 811 N Columbus St Unit 102
- 811 N Columbus St Unit 507
- 811 N Columbus St Unit 301
- 811 N Columbus St Unit 210
- 811 N Columbus St Unit 401
- 811 N Columbus St Unit 501
- 811 N Columbus St Unit 101
- 811 N Columbus St Unit 214
- 811 N Columbus St Unit 312
- 811 N Columbus St Unit 207
- 811 N Columbus St Unit 404
- 400 Madison St Unit 1008
- 400 Madison St Unit 304
- 400 Madison St Unit 409
- 724 N Saint Asaph St
- 728 N Saint Asaph St
- 730 N Saint Asaph St
- 610 Madison St Unit 102
- 610 Madison St Unit 202
- 610 Madison St Unit 203
- 610 Madison St Unit 201
- 610 Madison St Unit 205
- 610 Madison St Unit 200
- 610 Madison St Unit 204
- 610 Madison St Unit 101
- 610 Madison St Unit 100
- 610 Madison St
- 725 N Washington St
- 601 Wythe St
- 734 N Saint Asaph St
- 703 N Washington St
- 727 N Washington St
- 621 Wythe St
- 525 Wythe St