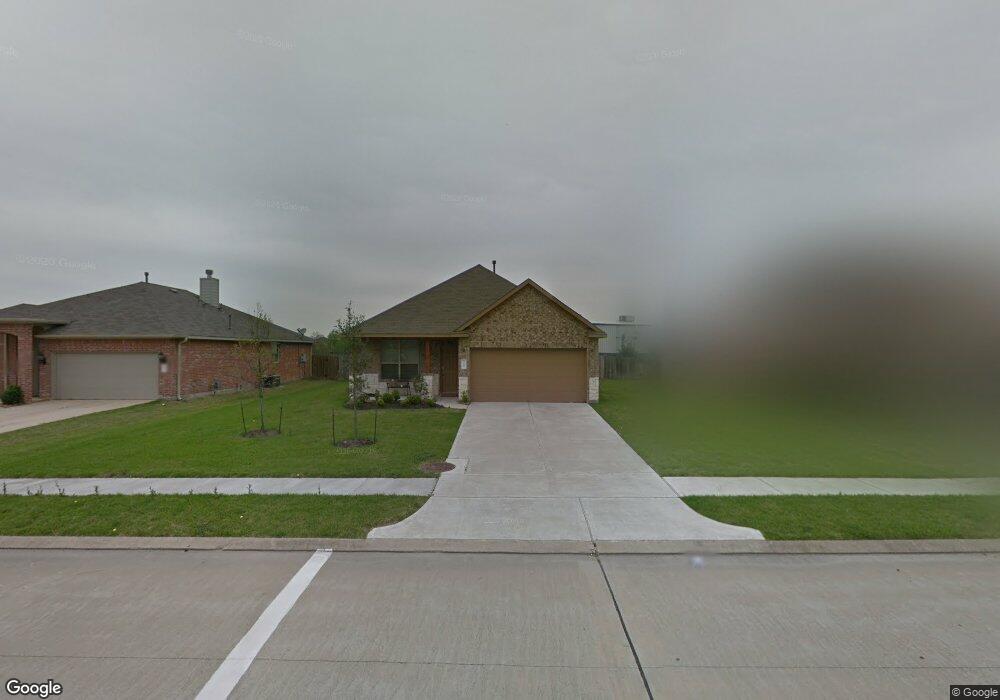
7205 Northfork Dr Pearland, TX 77584
Estimated Value: $317,000 - $337,000
3
Beds
2
Baths
1,710
Sq Ft
$191/Sq Ft
Est. Value
About This Home
This home is located at 7205 Northfork Dr, Pearland, TX 77584 and is currently estimated at $326,720, approximately $191 per square foot. 7205 Northfork Dr is a home located in Brazoria County with nearby schools including H.C. Carleston Elementary School, Sam Jamison Middle School, and Pearland Junior High School South.
Ownership History
Date
Name
Owned For
Owner Type
Purchase Details
Closed on
Oct 19, 2015
Sold by
Moore Michael
Bought by
Moore Michael and Moore Rebecca Treadway
Current Estimated Value
Purchase Details
Closed on
Jul 30, 2014
Sold by
Nguyen Van Thi Thu and Nguyen Thuan Huu
Bought by
Moore Michael
Home Financials for this Owner
Home Financials are based on the most recent Mortgage that was taken out on this home.
Original Mortgage
$159,999
Outstanding Balance
$122,408
Interest Rate
4.2%
Mortgage Type
VA
Estimated Equity
$204,312
Purchase Details
Closed on
Oct 8, 2012
Sold by
Bernard Nadia and Bernard William
Bought by
Thu Nguyen Van Thi and Thuy Nguyen Van Huu
Purchase Details
Closed on
Apr 23, 2010
Sold by
D R Horton Texas Ltd
Bought by
Bernhard Nadia
Home Financials for this Owner
Home Financials are based on the most recent Mortgage that was taken out on this home.
Original Mortgage
$121,098
Interest Rate
4.87%
Mortgage Type
Purchase Money Mortgage
Create a Home Valuation Report for This Property
The Home Valuation Report is an in-depth analysis detailing your home's value as well as a comparison with similar homes in the area
Home Values in the Area
Average Home Value in this Area
Purchase History
| Date | Buyer | Sale Price | Title Company |
|---|---|---|---|
| Moore Michael | -- | Infinity Title Co | |
| Moore Michael | -- | None Available | |
| Thu Nguyen Van Thi | -- | Stewart Title | |
| Bernhard Nadia | -- | None Available |
Source: Public Records
Mortgage History
| Date | Status | Borrower | Loan Amount |
|---|---|---|---|
| Open | Moore Michael | $159,999 | |
| Previous Owner | Bernhard Nadia | $121,098 |
Source: Public Records
Tax History Compared to Growth
Tax History
| Year | Tax Paid | Tax Assessment Tax Assessment Total Assessment is a certain percentage of the fair market value that is determined by local assessors to be the total taxable value of land and additions on the property. | Land | Improvement |
|---|---|---|---|---|
| 2025 | $4,838 | $307,640 | $33,860 | $273,780 |
| 2023 | $4,838 | $285,659 | $33,860 | $305,510 |
| 2022 | $7,026 | $259,690 | $33,860 | $225,830 |
| 2021 | $7,205 | $247,120 | $30,780 | $216,340 |
| 2020 | $6,868 | $239,040 | $30,780 | $208,260 |
| 2019 | $6,286 | $204,180 | $30,780 | $173,400 |
| 2018 | $6,165 | $201,010 | $30,780 | $170,230 |
| 2017 | $6,102 | $196,200 | $30,780 | $165,420 |
| 2016 | $6,038 | $196,200 | $30,780 | $165,420 |
| 2015 | $5,197 | $165,210 | $30,780 | $134,430 |
| 2014 | $5,197 | $157,390 | $30,780 | $126,610 |
Source: Public Records
Map
Nearby Homes
- 3402 Windmill Palm Dr
- 2534 Oak Rd
- 2526 Oak Rd
- 7123 Elgin St
- 9.6 AC Fite Rd
- 2826 Foxden Dr
- 7333 Fite Rd
- 6806 Adella Ct
- 4915 Pecan Grove Dr
- 3638 Manvel Rd
- 4811 Meadowglen Dr
- 3304 Autumn Forest Dr
- 4838 Pinder Ln
- 2815 Abbey Field Dr
- 1 Farm To Market 1128
- 2811 Afton Dr
- 4622 Pecan Grove Dr
- 4527 Brookren Ct
- 6407 Hillock Ln
- 3610 Kale St
- 7207 Northfork Dr
- 7203 Northfork Dr
- 7209 Northfork Dr
- 7201 Northfork Dr
- 7206 Northfork Dr
- 7208 Northfork Dr
- 7211 Northfork Dr
- 7204 Northfork Dr
- 3302 Brookwood Ln
- 7302 White Lane Ct
- 7202 Northfork Dr
- 000 Fm 1128
- 0000 Fm 1128
- 7304 White Lane Ct
- 0 N Cr 103 Unit 8026423
- 0 Nelson Rd Cr 408 Unit 1414821
- 0 Fite Rd N
- 0 McKnight Rd Cr 880 Unit 8190043
- LOT 1 Cullen Estates
- 7203 Valentine Ln