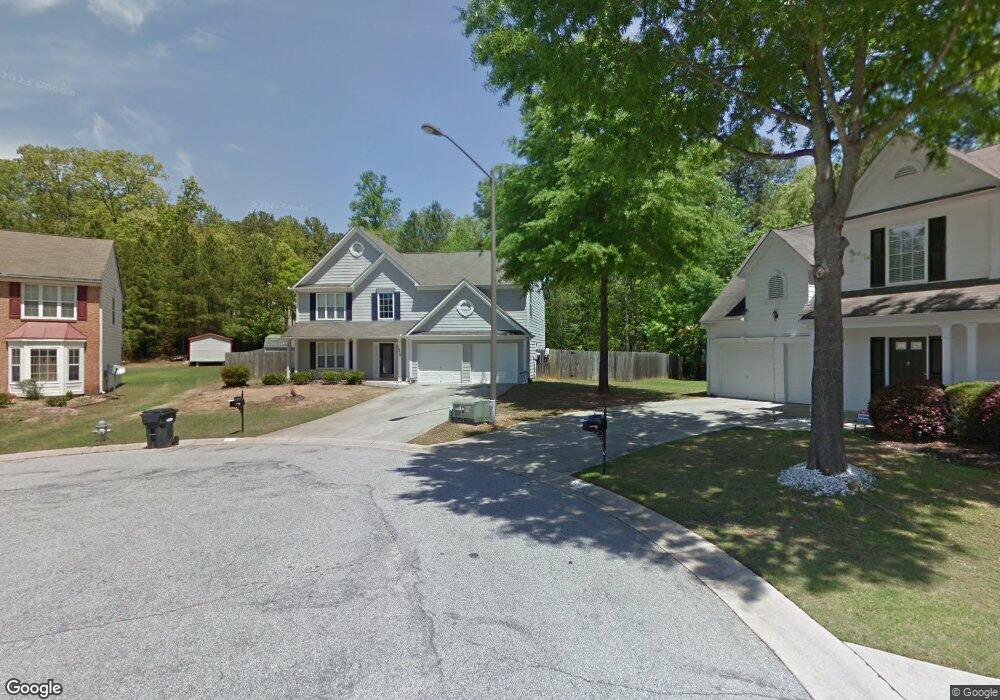
7206 Silverton Trail Austell, GA 30168
Estimated Value: $317,000 - $382,000
4
Beds
3
Baths
2,266
Sq Ft
$149/Sq Ft
Est. Value
About This Home
This home is located at 7206 Silverton Trail, Austell, GA 30168 and is currently estimated at $337,702, approximately $149 per square foot. 7206 Silverton Trail is a home located in Cobb County with nearby schools including Bryant Elementary School, Lindley Middle School, and Pebblebrook High School.
Ownership History
Date
Name
Owned For
Owner Type
Purchase Details
Closed on
Sep 22, 2006
Sold by
Paw Props Inc
Bought by
Merritt Albert G and Merritt Deborah A
Current Estimated Value
Home Financials for this Owner
Home Financials are based on the most recent Mortgage that was taken out on this home.
Original Mortgage
$168,000
Outstanding Balance
$99,842
Interest Rate
6.48%
Mortgage Type
New Conventional
Estimated Equity
$237,860
Purchase Details
Closed on
Jun 6, 2006
Sold by
Forniss Lisa Y
Bought by
Washington Mutual Bk
Purchase Details
Closed on
Jun 15, 1998
Sold by
Inc-Torrey D R Horton
Bought by
Forniss Lisa Y
Home Financials for this Owner
Home Financials are based on the most recent Mortgage that was taken out on this home.
Original Mortgage
$125,100
Interest Rate
7.1%
Mortgage Type
FHA
Create a Home Valuation Report for This Property
The Home Valuation Report is an in-depth analysis detailing your home's value as well as a comparison with similar homes in the area
Home Values in the Area
Average Home Value in this Area
Purchase History
| Date | Buyer | Sale Price | Title Company |
|---|---|---|---|
| Merritt Albert G | $168,000 | -- | |
| Washington Mutual Bk | $127,500 | -- | |
| Forniss Lisa Y | $125,500 | -- |
Source: Public Records
Mortgage History
| Date | Status | Borrower | Loan Amount |
|---|---|---|---|
| Open | Merritt Albert G | $168,000 | |
| Previous Owner | Forniss Lisa Y | $125,100 |
Source: Public Records
Tax History Compared to Growth
Tax History
| Year | Tax Paid | Tax Assessment Tax Assessment Total Assessment is a certain percentage of the fair market value that is determined by local assessors to be the total taxable value of land and additions on the property. | Land | Improvement |
|---|---|---|---|---|
| 2025 | $795 | $123,952 | $18,000 | $105,952 |
| 2024 | $797 | $123,952 | $18,000 | $105,952 |
| 2023 | $591 | $123,952 | $18,000 | $105,952 |
| 2022 | $649 | $74,512 | $12,000 | $62,512 |
| 2021 | $649 | $74,512 | $12,000 | $62,512 |
| 2020 | $649 | $74,512 | $12,000 | $62,512 |
| 2019 | $586 | $58,568 | $6,000 | $52,568 |
| 2018 | $1,504 | $58,568 | $6,000 | $52,568 |
| 2017 | $1,427 | $58,568 | $6,000 | $52,568 |
| 2016 | $1,222 | $51,404 | $4,800 | $46,604 |
| 2015 | $1,047 | $44,388 | $4,800 | $39,588 |
| 2014 | $851 | $37,468 | $0 | $0 |
Source: Public Records
Map
Nearby Homes
- 1243 Blairs Pointe Dr Unit 3
- 1195 Park Center Cir
- 1199 Park Center Cir
- 1203 Park Center Cir
- 7254 Silverton Trail
- 1186 Park Center Cir
- 1182 Park Center Cir
- 1163 Park Center Cir
- 7067 Pleasant Dr
- 7063 Pleasant Dr
- Redbud-Townhome Plan at Park Center Pointe - Hometown Series
- Bayberry-Townhome Plan at Park Center Pointe - Hometown Series
- 1311 Park Center Cir
- Wisteria-Townhome Plan at Park Center Pointe - Hometown Series
- 1211 Ling Way
- 7098 Pleasant Dr
- 00 Hembree Ln
- 0 Hembree Ln Unit 10633605
- 7210 Silverton Trail
- 7202 Silverton Trail
- 7214 Silverton Trail
- 7201 Silverton Trail
- 1191 Flamingo Dr Unit 4
- 1181 Flamingo Dr
- 7215 Silverton Trail
- 1193 Flamingo Dr
- 7218 Silverton Trail
- 7222 Silverton Trail
- 7233 Silverton Trail
- 7226 Silverton Trail
- 1221 Blairs Pointe Dr Unit 2
- 1221 Blairs Pointe Dr
- 1221 Blairs Pointe Dr SW
- 1221 Blairs Pte
- 1223 Blairs Pointe Dr Unit 2
- 1171 Flamingo Dr
- 7230 Silverton Trail
- 1215 Blairs Pointe Dr Unit 1