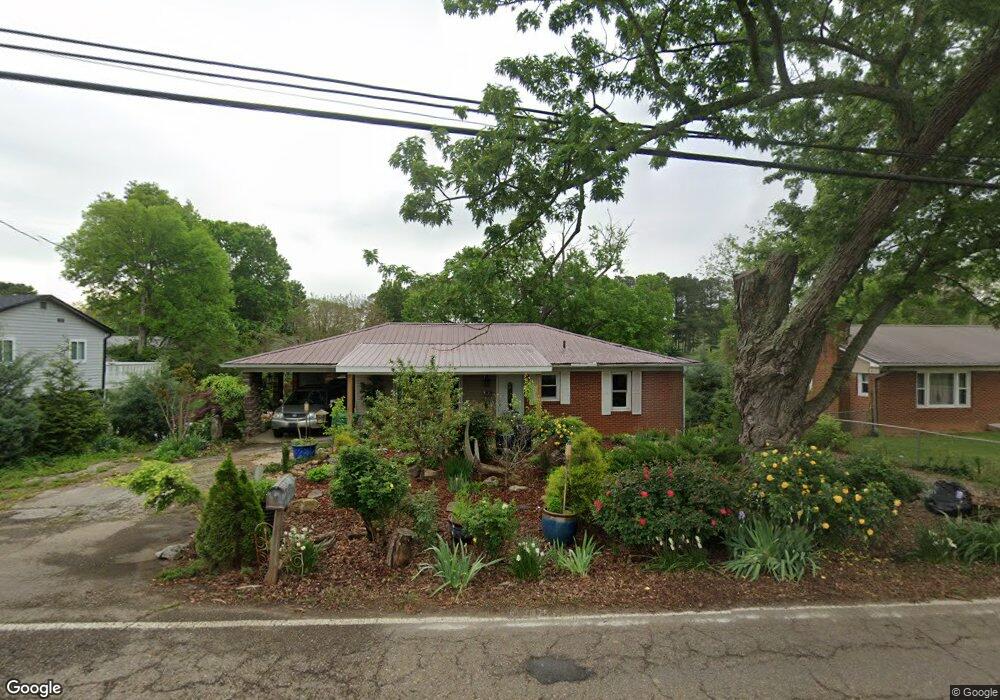
721 Jarnigan Ave Morristown, TN 37813
Estimated Value: $173,237 - $201,000
--
Bed
1
Bath
1,263
Sq Ft
$153/Sq Ft
Est. Value
About This Home
This home is located at 721 Jarnigan Ave, Morristown, TN 37813 and is currently estimated at $192,809, approximately $152 per square foot. 721 Jarnigan Ave is a home located in Hamblen County with nearby schools including Lincoln Heights Elementary School, Lincoln Heights Middle School, and Morristown West High School.
Ownership History
Date
Name
Owned For
Owner Type
Purchase Details
Closed on
Sep 29, 2015
Sold by
Crutchfield Steve F
Bought by
Hamilton Regina Lynn
Current Estimated Value
Purchase Details
Closed on
Oct 14, 2014
Sold by
Lee Anna Ruth Estate
Bought by
Lee Samuel Scott
Purchase Details
Closed on
Aug 17, 2001
Sold by
Hud
Bought by
Crutchfield Steve
Purchase Details
Closed on
Feb 5, 2001
Bought by
Secretary Of H U D %Golden Feather Realty
Purchase Details
Closed on
Jan 11, 2001
Bought by
Tennessee H D Agency #1114
Purchase Details
Closed on
Jun 1, 1998
Sold by
Mccloud Steve
Bought by
Woods Cheryl
Purchase Details
Closed on
Feb 12, 1996
Sold by
Morgan William H
Bought by
Mccloud Steve
Purchase Details
Closed on
Jul 10, 1992
Bought by
Mccloud Steve
Purchase Details
Closed on
Jul 5, 1972
Bought by
Morgan William H
Purchase Details
Closed on
Jul 14, 1959
Bought by
Morgan William H and Morgan Opal
Create a Home Valuation Report for This Property
The Home Valuation Report is an in-depth analysis detailing your home's value as well as a comparison with similar homes in the area
Home Values in the Area
Average Home Value in this Area
Purchase History
| Date | Buyer | Sale Price | Title Company |
|---|---|---|---|
| Hamilton Regina Lynn | $52,100 | -- | |
| Hamilton Regina Lynn | $52,120 | -- | |
| Lee Samuel Scott | -- | -- | |
| Crutchfield Steve | $45,251 | -- | |
| Secretary Of H U D %Golden Feather Realty | $62,600 | -- | |
| Tennessee H D Agency #1114 | $62,600 | -- | |
| Woods Cheryl | $59,000 | -- | |
| Mccloud Steve | $49,500 | -- | |
| Mccloud Steve | -- | -- | |
| Morgan William H | -- | -- | |
| Morgan William H | -- | -- |
Source: Public Records
Tax History Compared to Growth
Tax History
| Year | Tax Paid | Tax Assessment Tax Assessment Total Assessment is a certain percentage of the fair market value that is determined by local assessors to be the total taxable value of land and additions on the property. | Land | Improvement |
|---|---|---|---|---|
| 2024 | $390 | $22,150 | $3,350 | $18,800 |
| 2023 | $390 | $22,150 | $0 | $0 |
| 2022 | $700 | $22,150 | $3,350 | $18,800 |
| 2021 | $390 | $22,150 | $3,350 | $18,800 |
| 2020 | $857 | $27,150 | $3,350 | $23,800 |
| 2019 | $798 | $23,475 | $3,325 | $20,150 |
| 2018 | $739 | $23,475 | $3,325 | $20,150 |
| 2017 | $728 | $23,475 | $3,325 | $20,150 |
| 2016 | $695 | $23,475 | $3,325 | $20,150 |
| 2015 | $647 | $23,475 | $3,325 | $20,150 |
| 2014 | -- | $23,475 | $3,325 | $20,150 |
| 2013 | -- | $26,400 | $0 | $0 |
Source: Public Records
Map
Nearby Homes
- 440 S Fairmont Ave
- 837 Pauline Ave
- 203 Lincoln Ave
- 731 Lennie Ave
- 1530 Rayburn Dr
- Darwin Plan at Southwood
- Penwell Plan at Southwood
- Elston Plan at Southwood
- Robie Plan at Southwood
- Cali Plan at Southwood
- Belhaven Plan at Southwood
- 2024 Southwood Cir
- 2018 Southwood Cir
- 1049 Greenway Dr
- 900 Baird Ave
- 1476 Darbee Dr
- 1211 W 6th St N
- 816 W 2nd St N
- 1002 Watercrest St
- 722 W 2nd St N
- 713 Jarnigan Ave
- 729 Jarnigan Ave
- 720 Douglas Ave
- 726 Douglas Ave
- 714 Douglas Ave
- 733 Jarnigan Ave
- 730 Douglas Ave
- 705 Jarnigan Ave
- 722 Jarnigan Ave
- 710 Douglas Ave
- 728 Jarnigan Ave
- 804 Douglas Ave
- 708 Jarnigan Ave
- 704 Douglas Ave
- 1838 Lincoln Ave
- 808 Douglas Ave
- 734 Jarnigan Ave
- 815 Jarnigan Ave
- 812 Douglas Ave
- 723 Douglas Ave