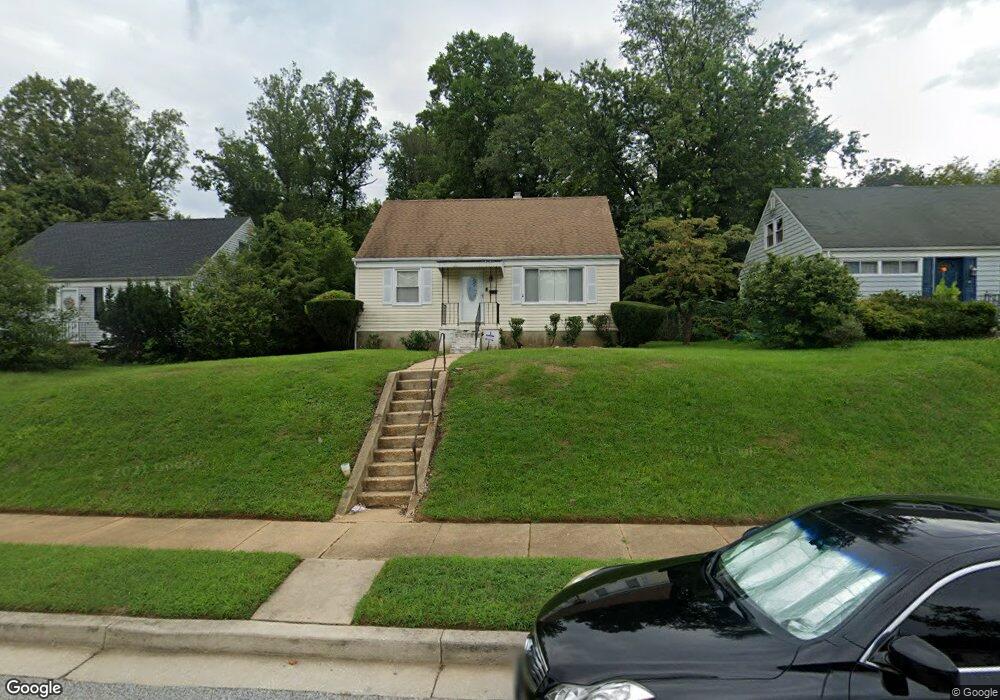
721 Templecliff Rd Pikesville, MD 21208
Estimated Value: $267,000 - $311,331
--
Bed
1
Bath
1,188
Sq Ft
$246/Sq Ft
Est. Value
About This Home
This home is located at 721 Templecliff Rd, Pikesville, MD 21208 and is currently estimated at $292,083, approximately $245 per square foot. 721 Templecliff Rd is a home located in Baltimore County with nearby schools including Bedford Elementary, Pikesville Middle School, and Milford Mill Academy.
Ownership History
Date
Name
Owned For
Owner Type
Purchase Details
Closed on
Feb 8, 2007
Sold by
Johnson Crystal
Bought by
Grimes Nicole
Current Estimated Value
Home Financials for this Owner
Home Financials are based on the most recent Mortgage that was taken out on this home.
Original Mortgage
$179,000
Outstanding Balance
$116,914
Interest Rate
7.85%
Mortgage Type
Purchase Money Mortgage
Estimated Equity
$175,169
Purchase Details
Closed on
Jul 20, 2006
Sold by
Johnson Crystal
Bought by
Grimes Nicole
Home Financials for this Owner
Home Financials are based on the most recent Mortgage that was taken out on this home.
Original Mortgage
$179,000
Interest Rate
7.85%
Mortgage Type
Purchase Money Mortgage
Purchase Details
Closed on
Dec 15, 1999
Sold by
Bassler Dorothy E
Bought by
Johnson Crystal and Johnson Cecil Taylor
Purchase Details
Closed on
Dec 17, 1990
Sold by
Jacek Esther S
Bought by
Bassler Dorothy E
Create a Home Valuation Report for This Property
The Home Valuation Report is an in-depth analysis detailing your home's value as well as a comparison with similar homes in the area
Home Values in the Area
Average Home Value in this Area
Purchase History
| Date | Buyer | Sale Price | Title Company |
|---|---|---|---|
| Grimes Nicole | $179,000 | -- | |
| Grimes Nicole | $179,000 | -- | |
| Johnson Crystal | $85,000 | -- | |
| Bassler Dorothy E | $65,000 | -- |
Source: Public Records
Mortgage History
| Date | Status | Borrower | Loan Amount |
|---|---|---|---|
| Open | Grimes Nicole | $179,000 | |
| Previous Owner | Grimes Nicole | $179,000 |
Source: Public Records
Tax History Compared to Growth
Tax History
| Year | Tax Paid | Tax Assessment Tax Assessment Total Assessment is a certain percentage of the fair market value that is determined by local assessors to be the total taxable value of land and additions on the property. | Land | Improvement |
|---|---|---|---|---|
| 2025 | $3,281 | $188,900 | $62,000 | $126,900 |
| 2024 | $3,281 | $174,533 | $0 | $0 |
| 2023 | $1,491 | $160,167 | $0 | $0 |
| 2022 | $2,690 | $145,800 | $62,000 | $83,800 |
| 2021 | $2,732 | $144,667 | $0 | $0 |
| 2020 | $2,732 | $143,533 | $0 | $0 |
| 2019 | $2,614 | $142,400 | $62,000 | $80,400 |
| 2018 | $2,501 | $141,733 | $0 | $0 |
| 2017 | $2,387 | $141,067 | $0 | $0 |
| 2016 | $2,140 | $140,400 | $0 | $0 |
| 2015 | $2,140 | $139,967 | $0 | $0 |
| 2014 | $2,140 | $139,533 | $0 | $0 |
Source: Public Records
Map
Nearby Homes
- 616 Sudbrook Rd
- 799 Milford Mill Rd
- 913 Adana Rd
- 937 Olmstead Rd
- 925 Milford Mill Rd
- 605 Upland Rd
- 725 Milford Mill Rd
- 611 Cylburn Rd
- 1002 Scotts Hill Dr
- 906 Scotts Hill Dr
- 1005 Parkvalley Ct
- 1313 Idylwood Rd
- 1318 Robin Rd
- 4124 Bedford Rd
- 3811 Coronado Rd
- 1303 Saddleback Rd
- 300 Sophia Ct
- 702 Westover Rd
- 306 Upland Rd
- 213 Sudbrook Ln
- 719 Templecliff Rd
- 723 Templecliff Rd
- 717 Templecliff Rd
- 725 Templecliff Rd
- 830 Judy Ln
- 828 Judy Ln
- 715 Templecliff Rd
- 720 Templecliff Rd
- 724 Templecliff Rd
- 727 Templecliff Rd
- 826 Judy Ln
- 718 Templecliff Rd
- 726 Templecliff Rd
- 729 Templecliff Rd
- 802 Olmstead Rd
- 716 Templecliff Rd
- 824 Judy Ln
- 728 Templecliff Rd
- 727 Cliffedge Rd