721 Woodmont Dr Marietta, GA 30062
Eastern Marietta NeighborhoodEstimated Value: $572,000 - $640,000
4
Beds
4
Baths
3,005
Sq Ft
$201/Sq Ft
Est. Value
About This Home
This home is located at 721 Woodmont Dr, Marietta, GA 30062 and is currently estimated at $604,677, approximately $201 per square foot. 721 Woodmont Dr is a home located in Cobb County with nearby schools including Sedalia Park Elementary School, East Cobb Middle School, and Wheeler High School.
Ownership History
Date
Name
Owned For
Owner Type
Purchase Details
Closed on
Mar 9, 2004
Sold by
Weatherby Shawn M and Weatherby Amy G
Bought by
Dawson Deborah L
Current Estimated Value
Home Financials for this Owner
Home Financials are based on the most recent Mortgage that was taken out on this home.
Original Mortgage
$256,500
Outstanding Balance
$134,017
Interest Rate
7.5%
Mortgage Type
New Conventional
Estimated Equity
$470,660
Purchase Details
Closed on
Mar 31, 1998
Sold by
Lampert Warren and Lampert Stephanie
Bought by
Weatherby Shawn M and Weatherby Amy
Home Financials for this Owner
Home Financials are based on the most recent Mortgage that was taken out on this home.
Original Mortgage
$154,000
Interest Rate
7.03%
Mortgage Type
New Conventional
Purchase Details
Closed on
Nov 30, 1993
Sold by
Bryant William B Karla
Bought by
Lampert Warren Stephanie
Home Financials for this Owner
Home Financials are based on the most recent Mortgage that was taken out on this home.
Original Mortgage
$140,800
Interest Rate
6.85%
Create a Home Valuation Report for This Property
The Home Valuation Report is an in-depth analysis detailing your home's value as well as a comparison with similar homes in the area
Home Values in the Area
Average Home Value in this Area
Purchase History
| Date | Buyer | Sale Price | Title Company |
|---|---|---|---|
| Dawson Deborah L | $285,000 | -- | |
| Weatherby Shawn M | $192,500 | -- | |
| Lampert Warren Stephanie | $176,000 | -- |
Source: Public Records
Mortgage History
| Date | Status | Borrower | Loan Amount |
|---|---|---|---|
| Open | Dawson Deborah L | $256,500 | |
| Previous Owner | Weatherby Shawn M | $154,000 | |
| Previous Owner | Lampert Warren Stephanie | $140,800 |
Source: Public Records
Tax History Compared to Growth
Tax History
| Year | Tax Paid | Tax Assessment Tax Assessment Total Assessment is a certain percentage of the fair market value that is determined by local assessors to be the total taxable value of land and additions on the property. | Land | Improvement |
|---|---|---|---|---|
| 2025 | $1,350 | $219,284 | $40,000 | $179,284 |
| 2024 | $1,355 | $219,284 | $40,000 | $179,284 |
| 2023 | $1,091 | $200,072 | $36,000 | $164,072 |
| 2022 | $1,152 | $151,356 | $30,000 | $121,356 |
| 2021 | $1,152 | $151,356 | $30,000 | $121,356 |
| 2020 | $3,756 | $148,280 | $25,200 | $123,080 |
| 2019 | $3,329 | $128,764 | $24,000 | $104,764 |
| 2018 | $3,329 | $128,764 | $24,000 | $104,764 |
| 2017 | $2,887 | $114,468 | $24,000 | $90,468 |
| 2016 | $2,890 | $114,468 | $24,000 | $90,468 |
| 2015 | $2,789 | $106,964 | $27,200 | $79,764 |
| 2014 | $2,811 | $106,964 | $0 | $0 |
Source: Public Records
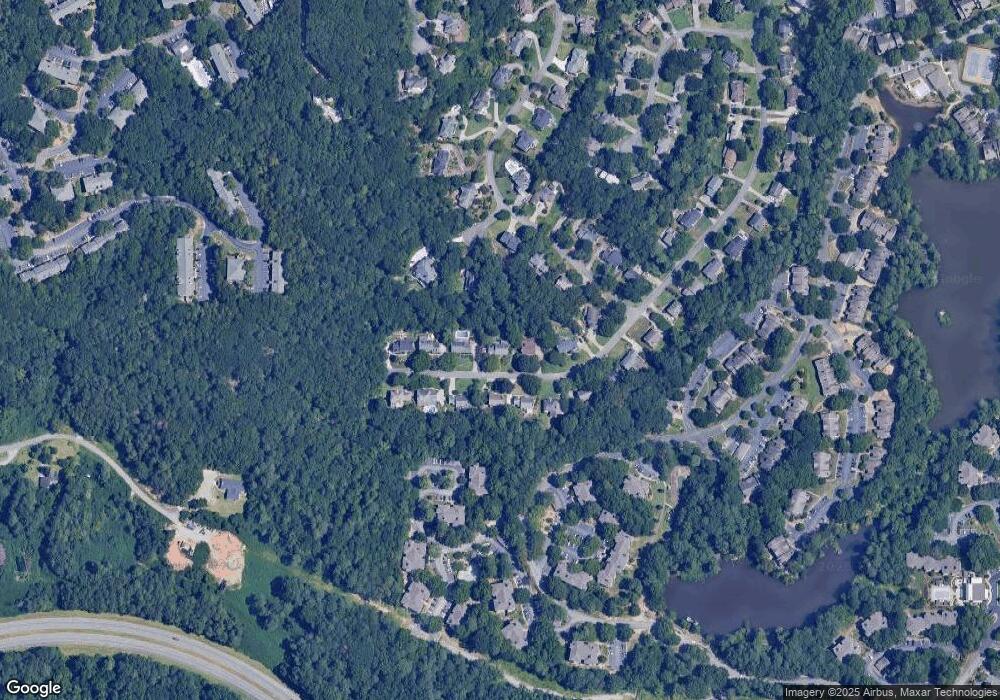
Map
Nearby Homes
- 1911 Woodmont Ct
- 915 Chipley Ct
- 1686 Grist Mill Dr
- 1670 Grist Mill Dr
- 951 Woodmont Dr
- 1070 Grist Mill Dr
- 943 Crestmanor Dr
- 939 Crestmanor Dr
- 931 Crestmanor Dr
- 935 Crestmanor Dr
- 923 Crestmanor Dr
- 1071 Grist Mill Dr
- 1059 Grist Mill Dr
- 1941 Pine Bluff
- 903 Edgewater Cir
- 1769 Millview Dr
- 1761 Millview Dr
- 1657 Cedar Bluff Way
- 873 Edgewater Cir
- 2106 Blaylock Dr
- 711 Woodmont Dr
- 731 Woodmont Dr
- 763 Fenwood Trail
- 701 Woodmont Dr
- 741 Woodmont Dr
- 720 Woodmont Dr
- 761 Oak Trail Dr
- 728 Woodmont Dr
- 710 Woodmont Dr
- 771 Oak Trail Dr
- 773 Oak Trail Dr Unit 36
- 773 Oak Trail Dr
- 691 Woodmont Dr
- 702 Woodmont Dr
- 730 Woodmont Dr
- 751 Woodmont Dr
- 765 Fenwood Trail
- 742 Woodmont Dr
- 700 Woodmont Dr
- 0 Fenwood Trail