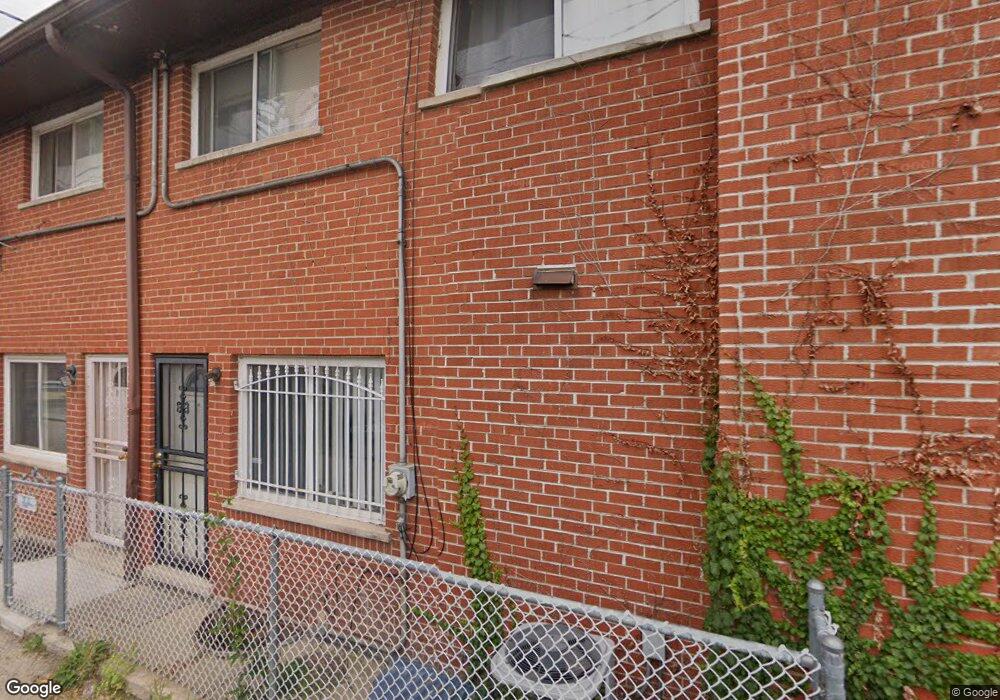
7216 N Rogers Ave Chicago, IL 60645
Rogers Park NeighborhoodEstimated Value: $234,000 - $297,000
3
Beds
2
Baths
1,151
Sq Ft
$232/Sq Ft
Est. Value
About This Home
This home is located at 7216 N Rogers Ave, Chicago, IL 60645 and is currently estimated at $266,471, approximately $231 per square foot. 7216 N Rogers Ave is a home located in Cook County with nearby schools including George Armstrong Elementary School, Sullivan High School, and Acero - Sor Juana Ines de la Cruz School.
Ownership History
Date
Name
Owned For
Owner Type
Purchase Details
Closed on
Oct 7, 2020
Sold by
Ly Henry and Ly Nan Khac
Bought by
Nth Investments Llc
Current Estimated Value
Purchase Details
Closed on
Aug 12, 2016
Sold by
Faisal Mohammad
Bought by
Ly Henry and Ly Nan Khac
Purchase Details
Closed on
Jul 16, 2014
Sold by
Housing & Urban Development
Bought by
Faisal Mohammad
Purchase Details
Closed on
Oct 4, 2013
Sold by
Miles
Bought by
The Secretary Housing & Urban Developmen
Purchase Details
Closed on
Sep 10, 2005
Sold by
Miles Michaele
Bought by
Miles Frederick and Miles Michaele
Purchase Details
Closed on
Apr 12, 2000
Sold by
James Jeanette
Bought by
Miles Michaele A
Home Financials for this Owner
Home Financials are based on the most recent Mortgage that was taken out on this home.
Original Mortgage
$114,775
Interest Rate
8.29%
Mortgage Type
FHA
Create a Home Valuation Report for This Property
The Home Valuation Report is an in-depth analysis detailing your home's value as well as a comparison with similar homes in the area
Home Values in the Area
Average Home Value in this Area
Purchase History
| Date | Buyer | Sale Price | Title Company |
|---|---|---|---|
| Nth Investments Llc | -- | First American Title Ins Co | |
| Ly Henry | $138,000 | Attorney | |
| Faisal Mohammad | $96,500 | -- | |
| Faisal Mohammad | $96,500 | -- | |
| The Secretary Housing & Urban Developmen | -- | None Available | |
| The Secretary Of Housing & Urban Develop | -- | None Available | |
| Miles Frederick | -- | -- | |
| Miles Michaele A | $115,000 | -- | |
| Miles Michaele | $115,000 | -- |
Source: Public Records
Mortgage History
| Date | Status | Borrower | Loan Amount |
|---|---|---|---|
| Previous Owner | Miles Michaele A | $114,775 |
Source: Public Records
Tax History Compared to Growth
Tax History
| Year | Tax Paid | Tax Assessment Tax Assessment Total Assessment is a certain percentage of the fair market value that is determined by local assessors to be the total taxable value of land and additions on the property. | Land | Improvement |
|---|---|---|---|---|
| 2024 | $3,798 | $21,000 | $1,863 | $19,137 |
| 2023 | $3,702 | $18,000 | $1,490 | $16,510 |
| 2022 | $3,702 | $18,000 | $1,490 | $16,510 |
| 2021 | $3,619 | $17,999 | $1,490 | $16,509 |
| 2020 | $3,553 | $15,947 | $2,898 | $13,049 |
| 2019 | $3,572 | $17,779 | $2,898 | $14,881 |
| 2018 | $3,512 | $17,779 | $2,898 | $14,881 |
| 2017 | $3,392 | $15,756 | $2,566 | $13,190 |
| 2016 | $3,156 | $15,756 | $2,566 | $13,190 |
| 2015 | $2,887 | $15,756 | $2,566 | $13,190 |
| 2014 | $2,724 | $17,248 | $2,484 | $14,764 |
| 2013 | $2,659 | $17,248 | $2,484 | $14,764 |
Source: Public Records
Map
Nearby Homes
- 7228 N Rogers Ave
- 7207 N Damen Ave Unit 2
- 7227 N Damen Ave
- 7223 N Damen Ave
- 7102 N Damen Ave Unit 3
- 2109 W Jarvis Ave Unit 1
- 7074 N Ridge Blvd Unit 1E
- 2044 W Jarvis Ave Unit 3G
- 2038 W Jarvis Ave Unit 20382D
- 2038 W Jarvis Ave Unit 2F
- 7234 N Hamilton Ave
- 7070 N Ridge Blvd Unit 1A
- 7320 N Rogers Ave Unit 514
- 2175 W Touhy Ave
- 7252 N Bell Ave
- 7344 N Ridge Blvd Unit 5C
- 7348 N Ridge Blvd Unit 16B
- 7019 N Ridge Blvd Unit 3B
- 7019 N Ridge Blvd Unit 3A
- 2101 W Greenleaf Ave
- 7216 N Rogers Ave
- 7216 N Rogers Ave Unit A
- 7222 N Rogers Ave
- 7222 N Rogers Ave
- 7222 N Rogers Ave
- 7226 N Rogers Ave
- 7226 W Rogers Unit 7226-8
- 7226 N Rogers Ave Unit 8
- 7226 N Rogers Ave Unit 6
- 7226 N Rogers Ave Unit 4
- 7226 N Rogers Ave Unit 1
- 7226 N Rogers Ave Unit 8
- 7226 N Rogers Ave Unit 2
- 7226 N Rogers Ave Unit 4
- 7226 N Rogers Ave Unit 3
- 7226 N Rogers Ave Unit 3
- 7226 N Rogers Ave Unit 4A
- 7226 N Rogers Ave Unit 1A
- 7226 N Rogers Ave Unit 1B
- 7226 N Rogers Ave Unit 7