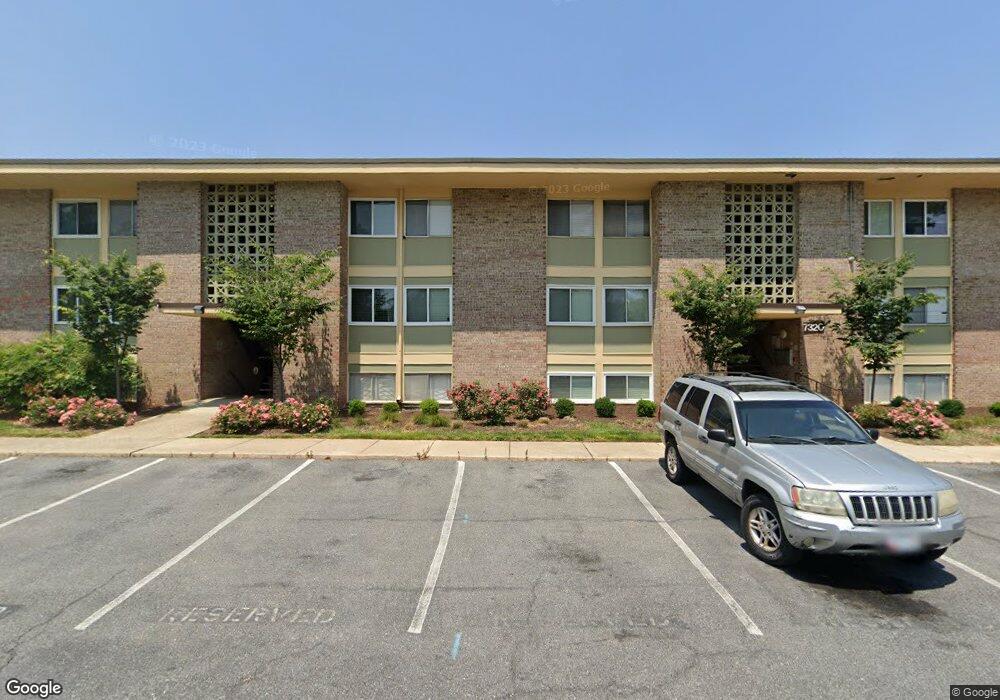
7227 Donnell Place District Heights, MD 20747
Estimated Value: $95,000 - $112,000
--
Bed
--
Bath
678
Sq Ft
$153/Sq Ft
Est. Value
About This Home
This home is located at 7227 Donnell Place, District Heights, MD 20747 and is currently estimated at $103,820, approximately $153 per square foot. 7227 Donnell Place is a home located in Prince George's County with nearby schools including Andrew Jackson Academy, Suitland High School, and Mount Calvary Catholic School.
Ownership History
Date
Name
Owned For
Owner Type
Purchase Details
Closed on
Feb 5, 2025
Sold by
Delores L Watkins Revocable Trust and Watkins Delores L
Bought by
Finch Aelese
Current Estimated Value
Home Financials for this Owner
Home Financials are based on the most recent Mortgage that was taken out on this home.
Original Mortgage
$69,375
Outstanding Balance
$68,907
Interest Rate
6.96%
Mortgage Type
New Conventional
Estimated Equity
$34,913
Purchase Details
Closed on
Dec 10, 2001
Sold by
Bankers Trust Co Of Ca N A Trs
Bought by
Watkins Delores L and Unit A 4
Purchase Details
Closed on
Jun 28, 2000
Sold by
Warren Jeffrey
Bought by
Bankers Trust Co Of Ca N A Trs and Provident Consumer Fin Svs
Purchase Details
Closed on
Mar 17, 1997
Sold by
Secretary Of Veterans Affairs
Bought by
Warren Jeffrey
Purchase Details
Closed on
Aug 28, 1995
Sold by
Burson John S
Bought by
Veterans Admn
Create a Home Valuation Report for This Property
The Home Valuation Report is an in-depth analysis detailing your home's value as well as a comparison with similar homes in the area
Home Values in the Area
Average Home Value in this Area
Purchase History
| Date | Buyer | Sale Price | Title Company |
|---|---|---|---|
| Finch Aelese | $92,500 | Interstate Title | |
| Finch Aelese | $92,500 | Interstate Title | |
| Watkins Delores L | $24,750 | -- | |
| Bankers Trust Co Of Ca N A Trs | $26,000 | -- | |
| Warren Jeffrey | $26,000 | -- | |
| Veterans Admn | $31,087 | -- |
Source: Public Records
Mortgage History
| Date | Status | Borrower | Loan Amount |
|---|---|---|---|
| Open | Finch Aelese | $69,375 | |
| Closed | Finch Aelese | $69,375 |
Source: Public Records
Tax History Compared to Growth
Tax History
| Year | Tax Paid | Tax Assessment Tax Assessment Total Assessment is a certain percentage of the fair market value that is determined by local assessors to be the total taxable value of land and additions on the property. | Land | Improvement |
|---|---|---|---|---|
| 2025 | $1,186 | $81,667 | -- | -- |
| 2024 | $1,186 | $73,333 | $0 | $0 |
| 2023 | $1,062 | $65,000 | $19,500 | $45,500 |
| 2022 | $638 | $57,333 | $0 | $0 |
| 2021 | $948 | $49,667 | $0 | $0 |
| 2020 | $720 | $42,000 | $12,600 | $29,400 |
| 2019 | $573 | $40,000 | $0 | $0 |
| 2018 | $660 | $38,000 | $0 | $0 |
| 2017 | $571 | $36,000 | $0 | $0 |
| 2016 | -- | $32,000 | $0 | $0 |
| 2015 | $1,410 | $28,000 | $0 | $0 |
| 2014 | $1,410 | $24,000 | $0 | $0 |
Source: Public Records
Map
Nearby Homes
- 7326 Donnell Place Unit D
- 7318 Donnell Place Unit C4
- 7316 Donnell Place Unit D2
- 7260 Donnell Place Unit B4
- 7129 Donnell Place Unit A
- 7105 Donnell Place Unit C4
- 7103 Donnell Place Unit D
- 7182 Donnell Place Unit AA-4
- 7203 Donnell Place Unit A1
- 7204 Donnell Place Unit C-5
- 7205 Donnell Place Unit A-2
- 7304 Donnell Place Unit B5
- 7308 Donnell Place Unit B1
- 7172 Donnell Place Unit C4
- 3512 Pumphrey Dr
- 7212 Beltz Dr
- 7110 Beltz Dr
- 3113 Lakehurst Ave
- 4020 Suit Rd
- 4011 Forestville Rd
- 7320 Donnell Place
- 7318 Donnell Place Unit B3
- 7322 Donnell Place Unit D7
- 7318 Donnell Place
- 7322 Donnell Place Unit B7
- 7318 Donnell Place Unit B4
- 7225 Donnell Place
- 7318 Donnell Place
- 7320 Donnell Place
- 7316 Donnell Place
- 7316 Donnell Place
- 7316 Donnell Place Unit C2
- 7318 Donnell Place
- 7316 Donnell Place Unit D1
- 7229 Donnell Place
- 7322 Donnell Place
- 7322 Donnell Place
- 7322 Donnell Place Unit B8
- 7320 Donnell Place Unit D5
- 7320 Donnell Place