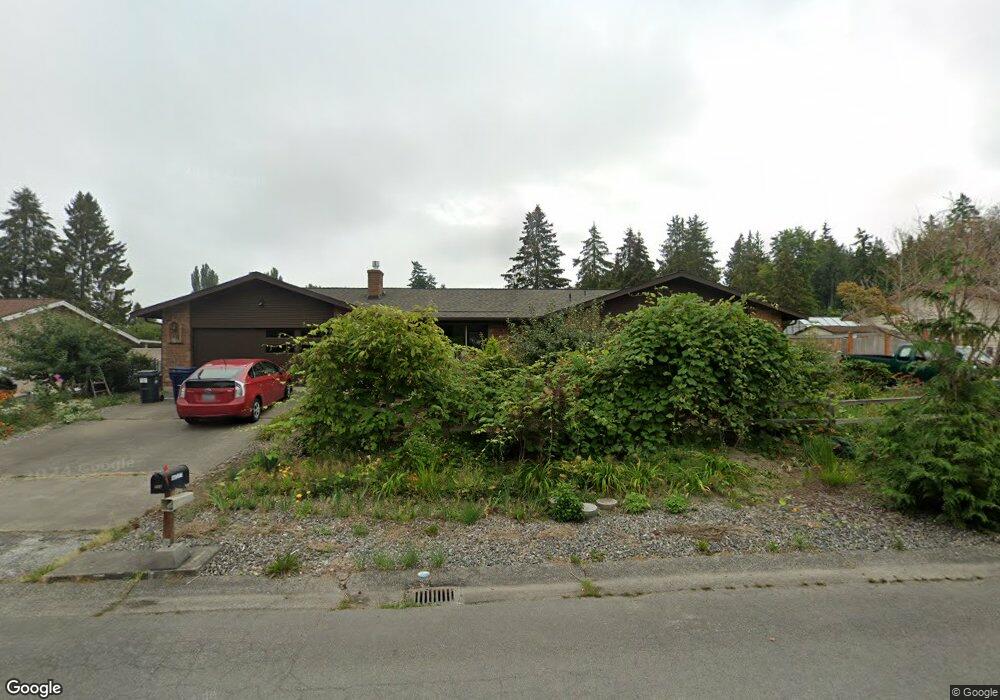
724 Upland Dr Mount Vernon, WA 98273
Estimated Value: $636,475 - $671,000
3
Beds
2
Baths
1,980
Sq Ft
$327/Sq Ft
Est. Value
About This Home
This home is located at 724 Upland Dr, Mount Vernon, WA 98273 and is currently estimated at $648,369, approximately $327 per square foot. 724 Upland Dr is a home located in Skagit County with nearby schools including Little Mountain Elementary School, Mount Baker Middle School, and Mount Vernon High School.
Ownership History
Date
Name
Owned For
Owner Type
Purchase Details
Closed on
Jun 17, 2024
Sold by
Barlett Gerald L and Bartlett Elizabeth
Bought by
Bartlett Family Residence Revocable Trust and Barlett
Current Estimated Value
Purchase Details
Closed on
Mar 1, 2016
Sold by
Hackler Jess D and Hackler Heather M
Bought by
Bartlett Gerald L and Bartlett Elizabeth
Home Financials for this Owner
Home Financials are based on the most recent Mortgage that was taken out on this home.
Original Mortgage
$238,360
Interest Rate
3.81%
Purchase Details
Closed on
Jan 22, 2009
Sold by
Ostiguy Linda K
Bought by
Hackler Jess D and Hackler Heather M
Home Financials for this Owner
Home Financials are based on the most recent Mortgage that was taken out on this home.
Original Mortgage
$245,550
Interest Rate
5.49%
Create a Home Valuation Report for This Property
The Home Valuation Report is an in-depth analysis detailing your home's value as well as a comparison with similar homes in the area
Home Values in the Area
Average Home Value in this Area
Purchase History
| Date | Buyer | Sale Price | Title Company |
|---|---|---|---|
| Bartlett Family Residence Revocable Trust | -- | None Listed On Document | |
| Bartlett Gerald L | $297,950 | Land Title & Escrow | |
| Hackler Jess D | $258,780 | Guardian Northwest Title Co |
Source: Public Records
Mortgage History
| Date | Status | Borrower | Loan Amount |
|---|---|---|---|
| Previous Owner | Bartlett Gerald L | $238,360 | |
| Previous Owner | Hackler Jess D | $245,550 |
Source: Public Records
Tax History Compared to Growth
Tax History
| Year | Tax Paid | Tax Assessment Tax Assessment Total Assessment is a certain percentage of the fair market value that is determined by local assessors to be the total taxable value of land and additions on the property. | Land | Improvement |
|---|---|---|---|---|
| 2024 | $5,367 | $536,500 | $199,200 | $337,300 |
| 2023 | $5,367 | $524,800 | $196,500 | $328,300 |
| 2022 | $4,531 | $477,400 | $159,900 | $317,500 |
| 2021 | $4,334 | $386,200 | $135,000 | $251,200 |
| 2020 | $4,188 | $343,600 | $0 | $0 |
| 2019 | $3,438 | $322,800 | $0 | $0 |
| 2018 | $4,006 | $300,300 | $0 | $0 |
| 2017 | $3,761 | $269,300 | $0 | $0 |
| 2016 | $3,549 | $255,000 | $69,600 | $185,400 |
| 2015 | $3,077 | $238,300 | $65,000 | $173,300 |
| 2013 | $3,062 | $199,100 | $0 | $0 |
Source: Public Records
Map
Nearby Homes
- 2511 Stonebridge Way
- 801 N 30th St
- 2725 E Fir St Unit 106
- 2725 E Fir St Unit 57
- 2725 E Fir St Unit 98
- 2725 E Fir St Unit 15
- 2725 E Fir St Unit 67
- 2725 E Fir St Unit 105
- 2310 Alison Ave
- 2901 Schuller Place
- 500 N Laventure Rd
- 2027 E Belair Dr
- 204 N 23rd St
- 323 N Laventure Rd Unit C
- 408 N 21st St Unit 410
- 1920 Mountain View Dr
- 325 N 21st St
- 105 N 30th St
- 701 Mountain View Dr
- 225 N 21st St
- 800 Upland Dr
- 714 Upland Dr
- 810 Upland Dr
- 725 Upland Dr
- 708 Upland Dr
- 715 Upland Dr
- 2701 Comanche Dr
- 709 Upland Dr
- 818 Upland Dr
- 2711 Comanche Dr
- 800 Addison Place
- 2520 Allison Ave
- 2520 Alison Ave
- 701 Upland Dr
- 2721 Comanche Dr
- 808 Addison Place
- 824 Upland Dr
- 0 Upland Place
- 816 Addison Place
- 2608 E Fir St