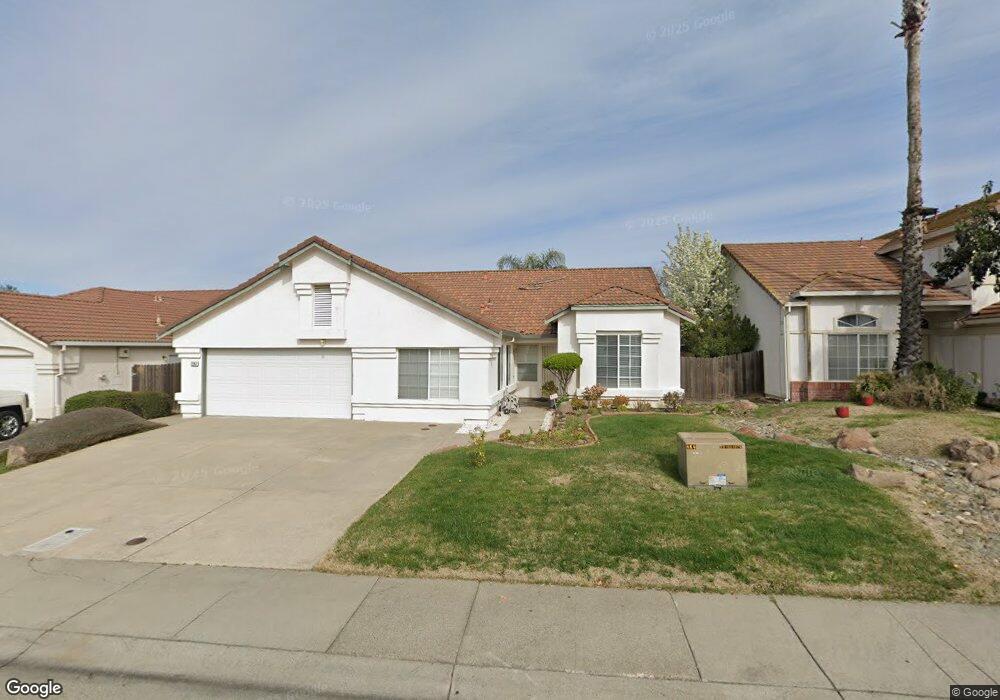
7247 Alpine Frost Dr Sacramento, CA 95823
North Laguna NeighborhoodEstimated Value: $421,000 - $512,000
4
Beds
2
Baths
1,710
Sq Ft
$281/Sq Ft
Est. Value
About This Home
This home is located at 7247 Alpine Frost Dr, Sacramento, CA 95823 and is currently estimated at $480,807, approximately $281 per square foot. 7247 Alpine Frost Dr is a home located in Sacramento County with nearby schools including Herman Leimbach Elementary School, Samuel Jackman Middle School, and Valley High School.
Ownership History
Date
Name
Owned For
Owner Type
Purchase Details
Closed on
Apr 8, 2011
Sold by
Lee Sunshine
Bought by
Lee Sunshine
Current Estimated Value
Home Financials for this Owner
Home Financials are based on the most recent Mortgage that was taken out on this home.
Original Mortgage
$56,000
Interest Rate
4.83%
Mortgage Type
New Conventional
Purchase Details
Closed on
Feb 22, 2010
Sold by
Lee Sunny C
Bought by
Lee Sunshine
Purchase Details
Closed on
May 3, 1995
Sold by
J & L Properties
Bought by
Carter Larry A
Home Financials for this Owner
Home Financials are based on the most recent Mortgage that was taken out on this home.
Original Mortgage
$75,000
Interest Rate
8.44%
Purchase Details
Closed on
Apr 28, 1995
Sold by
U S Home Corp
Bought by
Lee Sunny C and Lee Sunshine
Home Financials for this Owner
Home Financials are based on the most recent Mortgage that was taken out on this home.
Original Mortgage
$75,000
Interest Rate
8.44%
Create a Home Valuation Report for This Property
The Home Valuation Report is an in-depth analysis detailing your home's value as well as a comparison with similar homes in the area
Home Values in the Area
Average Home Value in this Area
Purchase History
| Date | Buyer | Sale Price | Title Company |
|---|---|---|---|
| Lee Sunshine | -- | Placer Title Company | |
| Lee Sunshine | -- | None Available | |
| Carter Larry A | -- | Old Republic Title Company | |
| Lee Sunny C | $130,000 | Stewart Title |
Source: Public Records
Mortgage History
| Date | Status | Borrower | Loan Amount |
|---|---|---|---|
| Closed | Lee Sunshine | $56,000 | |
| Closed | Lee Sunny C | $75,000 |
Source: Public Records
Tax History Compared to Growth
Tax History
| Year | Tax Paid | Tax Assessment Tax Assessment Total Assessment is a certain percentage of the fair market value that is determined by local assessors to be the total taxable value of land and additions on the property. | Land | Improvement |
|---|---|---|---|---|
| 2025 | $2,603 | $218,246 | $62,134 | $156,112 |
| 2024 | $2,603 | $213,967 | $60,916 | $153,051 |
| 2023 | $2,531 | $209,772 | $59,722 | $150,050 |
| 2022 | $2,501 | $205,659 | $58,551 | $147,108 |
| 2021 | $2,462 | $201,627 | $57,403 | $144,224 |
| 2020 | $2,424 | $199,561 | $56,815 | $142,746 |
| 2019 | $2,380 | $195,649 | $55,701 | $139,948 |
| 2018 | $2,316 | $191,813 | $54,609 | $137,204 |
| 2017 | $2,270 | $188,053 | $53,539 | $134,514 |
| 2016 | $2,204 | $184,367 | $52,490 | $131,877 |
| 2015 | $2,159 | $181,599 | $51,702 | $129,897 |
| 2014 | $2,138 | $178,043 | $50,690 | $127,353 |
Source: Public Records
Map
Nearby Homes
- 8115 Gandy Dancer Way
- 8095 E Stockton Blvd
- 8045 Arroyo Vista Dr
- 8210 Gandy Dancer Way
- 57 Kennelford Cir
- 0 Rangeview Ln
- 8216 Center Pkwy
- 7901 Stevenson Ave
- 7715 Cotton Ln
- 44 Hallowell Ct
- 39 Hallowell Ct
- 62 Hallowell Ct
- 45 Hallowell Ct
- 51 Hallowell Ct
- 57 Hallowell Ct
- 63 Hallowell Ct
- 8220 Center Pkwy Unit 38
- 8228 Center Pkwy Unit 46
- 8200 Center Pkwy Unit 9
- 8244 Center Pkwy Unit 65
- 7251 Alpine Frost Dr
- 8271 Grandstaff Dr
- 7255 Alpine Frost Dr
- 7239 Alpine Frost Dr
- 8275 Grandstaff Dr
- 8267 Grandstaff Dr
- 8279 Grandstaff Dr
- 7259 Alpine Frost Dr
- 7248 Alpine Frost Dr
- 7252 Alpine Frost Dr
- 7235 Alpine Frost Dr
- 7244 Alpine Frost Dr
- 7256 Alpine Frost Dr
- 8283 Grandstaff Dr
- 8263 Grandstaff Dr
- 7240 Alpine Frost Dr
- 7260 Alpine Frost Dr
- 7236 Alpine Frost Dr
- 8270 Grandstaff Dr
- 8274 Grandstaff Dr