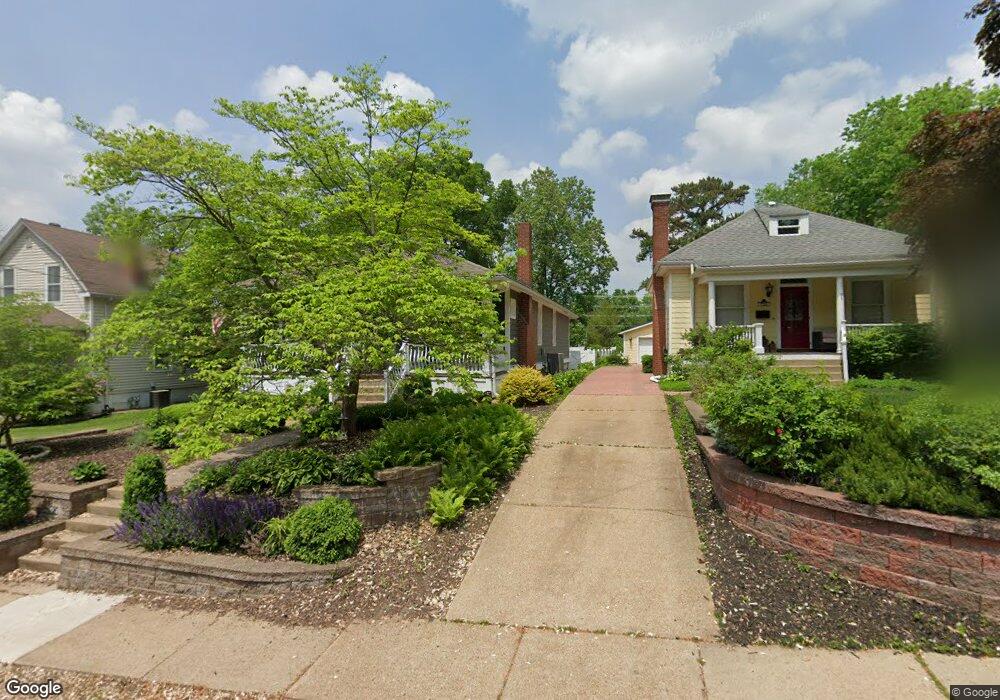
725 Atalanta Ave Saint Louis, MO 63119
Estimated Value: $286,000 - $339,164
4
Beds
1
Bath
1,241
Sq Ft
$255/Sq Ft
Est. Value
About This Home
This home is located at 725 Atalanta Ave, Saint Louis, MO 63119 and is currently estimated at $316,291, approximately $254 per square foot. 725 Atalanta Ave is a home located in St. Louis County with nearby schools including Avery Elementary School, Hixson Middle School, and Webster Groves High School.
Ownership History
Date
Name
Owned For
Owner Type
Purchase Details
Closed on
Dec 19, 2012
Sold by
Mcreynolds Deborah T
Bought by
Mcreynolds Deborah T
Current Estimated Value
Home Financials for this Owner
Home Financials are based on the most recent Mortgage that was taken out on this home.
Original Mortgage
$156,000
Outstanding Balance
$68,947
Interest Rate
3.37%
Mortgage Type
New Conventional
Estimated Equity
$247,344
Purchase Details
Closed on
Aug 2, 1999
Sold by
Stolze David M
Bought by
Mcreynolds Deborah T
Home Financials for this Owner
Home Financials are based on the most recent Mortgage that was taken out on this home.
Original Mortgage
$120,000
Interest Rate
7.12%
Purchase Details
Closed on
Mar 8, 1999
Sold by
Ridgemoor Investments Inc
Bought by
Stolze David M
Create a Home Valuation Report for This Property
The Home Valuation Report is an in-depth analysis detailing your home's value as well as a comparison with similar homes in the area
Home Values in the Area
Average Home Value in this Area
Purchase History
| Date | Buyer | Sale Price | Title Company |
|---|---|---|---|
| Mcreynolds Deborah T | -- | Integrity Land Title Co Inc | |
| Mcreynolds Deborah T | $164,500 | -- | |
| Stolze David M | $82,000 | -- | |
| Ridgemoor Investments Inc | $71,750 | -- |
Source: Public Records
Mortgage History
| Date | Status | Borrower | Loan Amount |
|---|---|---|---|
| Open | Mcreynolds Deborah T | $156,000 | |
| Closed | Mcreynolds Deborah T | $120,000 | |
| Closed | Stolze David M | -- |
Source: Public Records
Tax History Compared to Growth
Tax History
| Year | Tax Paid | Tax Assessment Tax Assessment Total Assessment is a certain percentage of the fair market value that is determined by local assessors to be the total taxable value of land and additions on the property. | Land | Improvement |
|---|---|---|---|---|
| 2025 | $3,464 | $50,860 | $41,040 | $9,820 |
| 2024 | $3,464 | $49,520 | $29,850 | $19,670 |
| 2023 | $3,447 | $49,520 | $29,850 | $19,670 |
| 2022 | $3,276 | $43,680 | $29,850 | $13,830 |
| 2021 | $3,265 | $43,680 | $29,850 | $13,830 |
| 2020 | $3,135 | $39,050 | $29,850 | $9,200 |
| 2019 | $3,113 | $39,050 | $29,850 | $9,200 |
| 2018 | $3,179 | $35,440 | $20,900 | $14,540 |
| 2017 | $3,158 | $35,440 | $20,900 | $14,540 |
| 2016 | $3,300 | $35,510 | $17,920 | $17,590 |
| 2015 | $3,311 | $35,510 | $17,920 | $17,590 |
| 2014 | $3,041 | $31,710 | $12,670 | $19,040 |
Source: Public Records
Map
Nearby Homes
- 716 Clark Ave
- 840 Marshall Ave
- 835 N Forest Ave
- 808 Greeley Ave
- 619 N Bompart Ave
- 544 Summit Ave
- 946 Marshall Ave Unit D
- 940 Brookside Ave
- 610 Cornelia Ave
- 400 Marion Ave
- 1048 Kuhlman Ln
- 570 N Laclede Station Rd
- 554 N Laclede Station Rd
- 1052 Kuhlman Ln
- 1045 Tuxedo Blvd
- 1051 Kuhlman Ln
- 2655 Salem Rd
- 441 Park Rd
- 8106 Fawn Ave
- 2855 Laclede Station Rd
- 723 Atalanta Ave
- 729 Atalanta Ave
- 735 Atalanta Ave
- 719 Atalanta Ave
- 724 Marshall Ave
- 728 Marshall Ave
- 720 Marshall Ave
- 739 Atalanta Ave
- 715 Atalanta Ave
- 730 Marshall Ave
- 714 Marshall Ave
- 726 Atalanta Ave
- 741 Atalanta Ave
- 711 Atalanta Ave
- 732 Marshall Ave
- 712 Marshall Ave
- 730 Atalanta Ave
- 722 Atalanta Ave
- 732 Atalanta Ave
- 716 Atalanta Ave