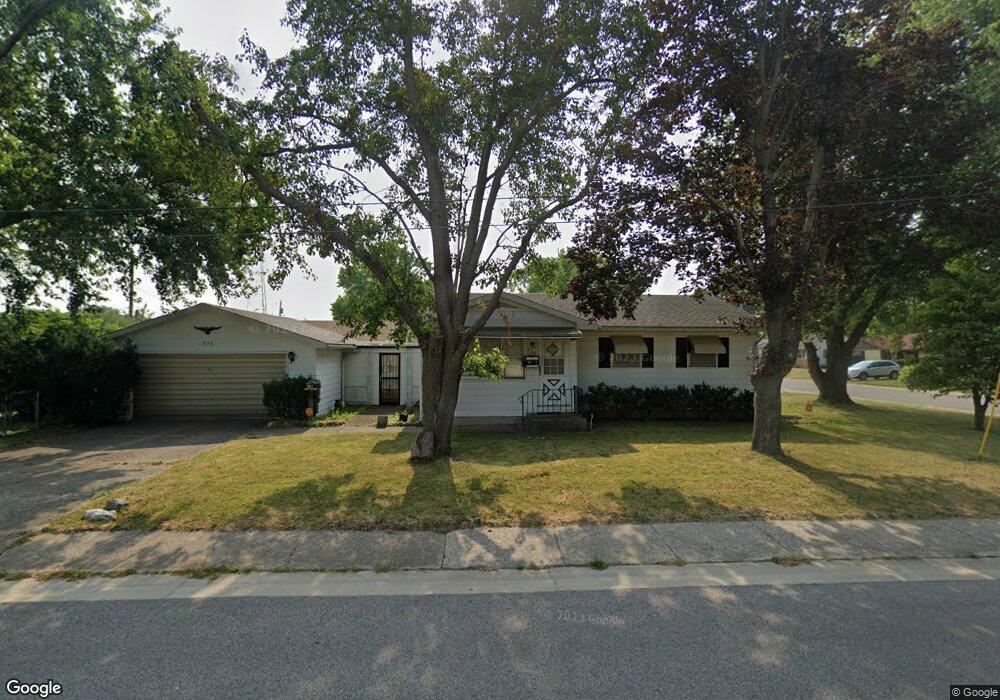
726 S Christmas Seal Dr Springfield, IL 62703
Springfield Far East District NeighborhoodEstimated Value: $71,000 - $82,000
--
Bed
--
Bath
--
Sq Ft
8,625
Sq Ft Lot
About This Home
This home is located at 726 S Christmas Seal Dr, Springfield, IL 62703 and is currently estimated at $75,235. 726 S Christmas Seal Dr is a home located in Sangamon County with nearby schools including Wilcox Elementary School, Washington Middle School, and Springfield Southeast High School.
Ownership History
Date
Name
Owned For
Owner Type
Purchase Details
Closed on
Oct 16, 2001
Current Estimated Value
Purchase Details
Closed on
Jun 25, 2001
Create a Home Valuation Report for This Property
The Home Valuation Report is an in-depth analysis detailing your home's value as well as a comparison with similar homes in the area
Home Values in the Area
Average Home Value in this Area
Purchase History
| Date | Buyer | Sale Price | Title Company |
|---|---|---|---|
| -- | -- | -- | |
| -- | -- | -- |
Source: Public Records
Tax History Compared to Growth
Tax History
| Year | Tax Paid | Tax Assessment Tax Assessment Total Assessment is a certain percentage of the fair market value that is determined by local assessors to be the total taxable value of land and additions on the property. | Land | Improvement |
|---|---|---|---|---|
| 2024 | $1,311 | $21,603 | $2,579 | $19,024 |
| 2023 | $1,214 | $19,733 | $2,356 | $17,377 |
| 2022 | $1,140 | $18,719 | $2,235 | $16,484 |
| 2021 | $1,082 | $18,018 | $2,151 | $15,867 |
| 2020 | $1,061 | $18,045 | $2,154 | $15,891 |
| 2019 | $1,040 | $17,982 | $2,146 | $15,836 |
| 2018 | $1,180 | $19,966 | $2,137 | $17,829 |
| 2017 | $1,149 | $19,707 | $2,109 | $17,598 |
| 2016 | $1,119 | $19,419 | $2,078 | $17,341 |
| 2015 | $1,102 | $19,187 | $2,053 | $17,134 |
| 2014 | $1,083 | $19,063 | $2,040 | $17,023 |
| 2013 | $1,058 | $19,063 | $2,040 | $17,023 |
Source: Public Records
Map
Nearby Homes
- 530 S Livingston St Unit 1
- 2310 E Kansas St
- 2128 E Capitol Ave
- 1105 Knoll Pointe Place
- 230 White City Blvd
- 2331 South Grand Ave E
- 2152 E Adams St
- 2009 E Kansas St
- 2132 E Adams St
- 2991 Niccolls Rd
- 143 S Wesley St Unit 1
- 1901 E Edwards St
- 1118 S Martin Luther King Junior Dr
- 1715 E Clay St
- 1813 Greentree Rd
- 1920 S 19th St
- 420 S 16th St
- 1513 E Edwards St
- 300 Forrest Ave Unit 59
- 300 Forrest Ave Unit 2
- 2621 E Lawrence Ave
- 725 S Christmas Seal Dr
- 2627 E Lawrence Ave
- 2616 E Lawrence Ave
- 2620 E Lawrence Ave
- 14 Manor Ct
- 2624 E Lawrence Ave
- 2631 E Lawrence Ave
- 12 Manor Ct
- 2520 E Cook St
- 10 Manor Ct
- 2628 E Lawrence Ave
- 13 Manor Ct
- 2632 E Lawrence Ave
- 2635 E Lawrence Ave
- 8 Manor Ct
- 2636 E Lawrence Ave
- 6 Manor Ct
- 11 Manor Ct
- 2641 E Lawrence Ave