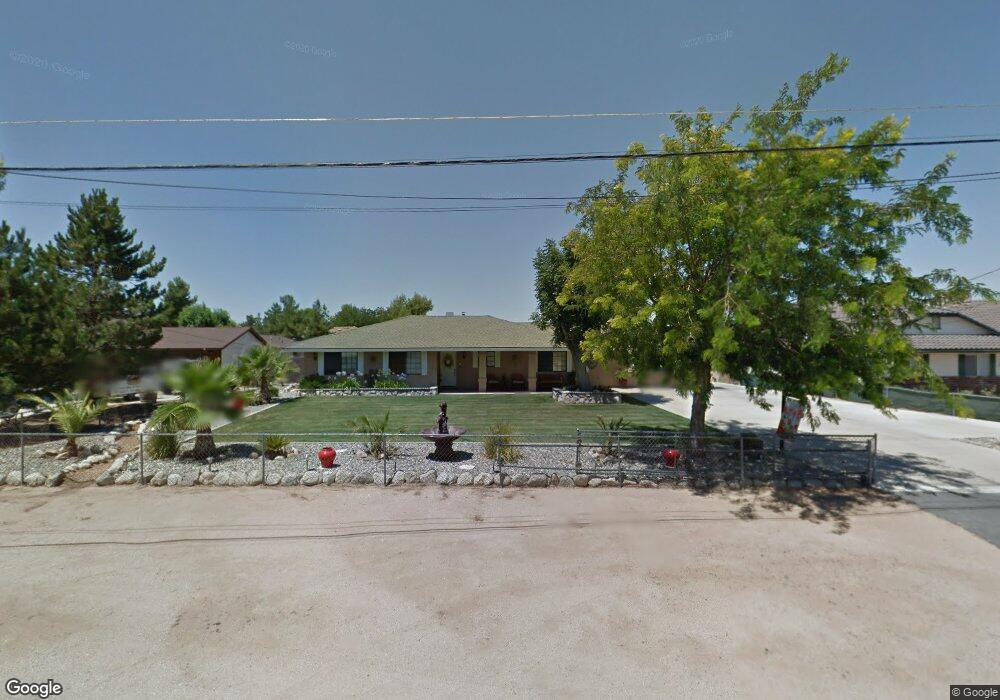
7270 Kenyon Ave Hesperia, CA 92345
The Mesa NeighborhoodEstimated Value: $477,760 - $616,000
3
Beds
2
Baths
2,171
Sq Ft
$250/Sq Ft
Est. Value
About This Home
This home is located at 7270 Kenyon Ave, Hesperia, CA 92345 and is currently estimated at $543,190, approximately $250 per square foot. 7270 Kenyon Ave is a home located in San Bernardino County with nearby schools including Kingston Elementary School, Ranchero Middle School, and Sultana High School.
Ownership History
Date
Name
Owned For
Owner Type
Purchase Details
Closed on
May 27, 2016
Sold by
Barber Staci Eluma Rhea
Bought by
Cook Brenda and Montez Freddie
Current Estimated Value
Home Financials for this Owner
Home Financials are based on the most recent Mortgage that was taken out on this home.
Original Mortgage
$218,000
Outstanding Balance
$173,730
Interest Rate
3.61%
Mortgage Type
New Conventional
Estimated Equity
$369,460
Purchase Details
Closed on
Nov 19, 2009
Sold by
Cook Brenda
Bought by
Montez Freddie and Cook Brenda
Purchase Details
Closed on
Jul 11, 2002
Sold by
Dubois Daniel
Bought by
Cook Brenda
Home Financials for this Owner
Home Financials are based on the most recent Mortgage that was taken out on this home.
Original Mortgage
$148,667
Interest Rate
6.06%
Mortgage Type
FHA
Purchase Details
Closed on
Aug 9, 1995
Sold by
Allison Robert D
Bought by
Dubois Daniel and Dubois Norma
Create a Home Valuation Report for This Property
The Home Valuation Report is an in-depth analysis detailing your home's value as well as a comparison with similar homes in the area
Home Values in the Area
Average Home Value in this Area
Purchase History
| Date | Buyer | Sale Price | Title Company |
|---|---|---|---|
| Cook Brenda | -- | Chicago Title Inland Empire | |
| Montez Freddie | -- | None Available | |
| Cook Brenda | $152,000 | Stewart Title Company | |
| Dubois Daniel | -- | American Title Ins Co |
Source: Public Records
Mortgage History
| Date | Status | Borrower | Loan Amount |
|---|---|---|---|
| Open | Cook Brenda | $218,000 | |
| Previous Owner | Cook Brenda | $148,667 |
Source: Public Records
Tax History Compared to Growth
Tax History
| Year | Tax Paid | Tax Assessment Tax Assessment Total Assessment is a certain percentage of the fair market value that is determined by local assessors to be the total taxable value of land and additions on the property. | Land | Improvement |
|---|---|---|---|---|
| 2025 | $2,352 | $220,145 | $44,029 | $176,116 |
| 2024 | $2,352 | $215,829 | $43,166 | $172,663 |
| 2023 | $2,325 | $211,597 | $42,320 | $169,277 |
| 2022 | $2,271 | $207,448 | $41,490 | $165,958 |
| 2021 | $2,229 | $203,380 | $40,676 | $162,704 |
| 2020 | $2,202 | $201,295 | $40,259 | $161,036 |
| 2019 | $2,155 | $197,348 | $39,470 | $157,878 |
| 2018 | $2,113 | $193,478 | $38,696 | $154,782 |
| 2017 | $2,074 | $189,684 | $37,937 | $151,747 |
| 2016 | $2,029 | $185,965 | $37,193 | $148,772 |
| 2015 | $2,003 | $183,171 | $36,634 | $146,537 |
| 2014 | $1,975 | $179,583 | $35,916 | $143,667 |
Source: Public Records
Map
Nearby Homes
- 0 Kenyon Ave
- 7215 Lyons Ave
- 7165 Lyons Ave
- 7336 Hastings Ave
- 17323 Fairburn St
- 7426 Hastings Ave
- 17111 Ranchero St
- 17590 El Cajon Dr
- 7535 Kenyon Ave
- 0 Farmdale Ave Unit IG25128388
- 7144 Farmdale Ave
- Residence Two Plan at Silverwood - Journey
- Residence Three Plan at Silverwood - Journey
- Residence Four Plan at Silverwood - Journey
- Residence One Plan at Silverwood - Journey
- 7128 Farmdale Ave
- 0 Oxford Ave Unit HD25072687
- 7112 Farmdale Ave
- 7128 Doheny Ct
- 7101 Doheny Ct
- 7250 Kenyon Ave
- 7288 Kenyon Ave
- 7240 Kenyon Ave
- 7265 Jenkins Ave
- 17365 Ranchero Rd
- 7245 Jenkins Ave
- 7265 Kenyon Ave
- 7245 Kenyon Ave
- 7285 Kenyon Ave
- 7312 Kenyon Ave
- 7235 Kenyon Ave
- 7222 Kenyon Ave
- 7235 Jenkins Ave
- 0 Kenyon Unit EV14132814
- 0 Kenyon Unit EV15188107
- 0 Kenyon Unit EV16087090
- 0 Kenyon Unit EV16707802
- 0 Kenyon Unit 437623
- 0 Kenyon Unit 477012
- 0 Kenyon Unit 461578