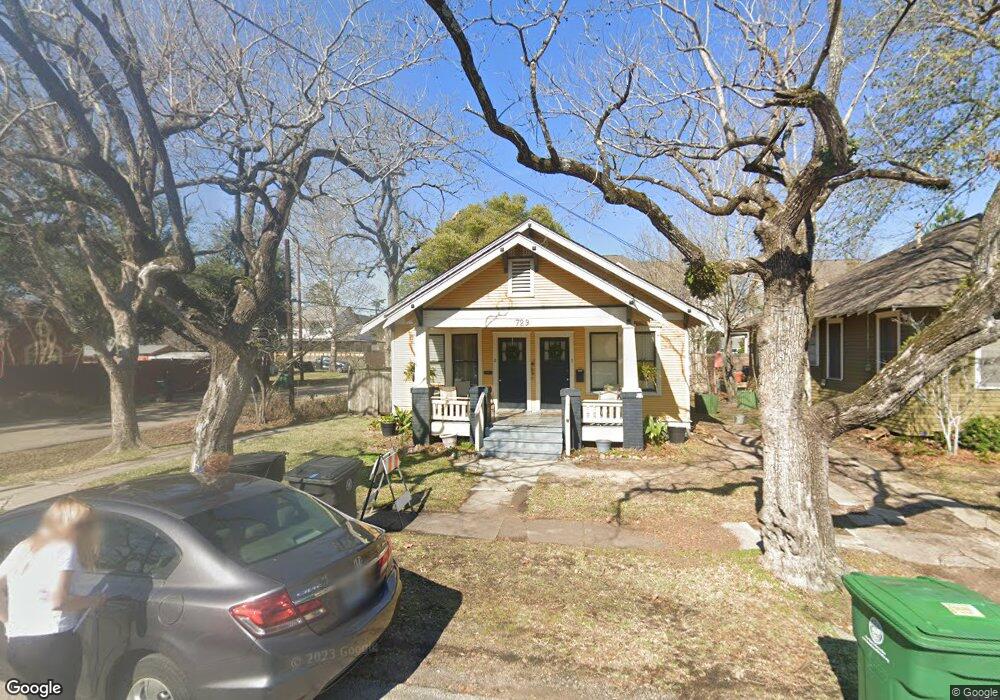
729 Omar St Houston, TX 77009
Greater Heights NeighborhoodEstimated Value: $535,475 - $609,000
3
Beds
3
Baths
1,454
Sq Ft
$387/Sq Ft
Est. Value
About This Home
This home is located at 729 Omar St, Houston, TX 77009 and is currently estimated at $563,369, approximately $387 per square foot. 729 Omar St is a home located in Harris County with nearby schools including Travis Elementary School, Hogg Middle, and Heights High School.
Ownership History
Date
Name
Owned For
Owner Type
Purchase Details
Closed on
Jun 30, 2014
Sold by
Bond Daniel
Bought by
Elzerman Sandra K
Current Estimated Value
Home Financials for this Owner
Home Financials are based on the most recent Mortgage that was taken out on this home.
Original Mortgage
$273,750
Outstanding Balance
$208,750
Interest Rate
4.19%
Mortgage Type
New Conventional
Estimated Equity
$354,619
Purchase Details
Closed on
Jun 23, 2005
Sold by
Blossom Eric and Blossom John
Bought by
Bond Daniel
Home Financials for this Owner
Home Financials are based on the most recent Mortgage that was taken out on this home.
Original Mortgage
$148,000
Interest Rate
6.25%
Mortgage Type
Fannie Mae Freddie Mac
Purchase Details
Closed on
Oct 24, 2002
Sold by
Collins J D
Bought by
Blossman Eric
Purchase Details
Closed on
Aug 31, 2001
Sold by
Fitz Bernice L
Bought by
Collins J D
Create a Home Valuation Report for This Property
The Home Valuation Report is an in-depth analysis detailing your home's value as well as a comparison with similar homes in the area
Home Values in the Area
Average Home Value in this Area
Purchase History
| Date | Buyer | Sale Price | Title Company |
|---|---|---|---|
| Elzerman Sandra K | -- | Fidelity National Title | |
| Bond Daniel | -- | Ameripoint Title | |
| Blossman Eric | -- | Chicago Title | |
| Collins J D | -- | Chicago Title |
Source: Public Records
Mortgage History
| Date | Status | Borrower | Loan Amount |
|---|---|---|---|
| Open | Elzerman Sandra K | $273,750 | |
| Previous Owner | Bond Daniel | $148,000 | |
| Closed | Bond Daniel | $37,000 |
Source: Public Records
Tax History Compared to Growth
Tax History
| Year | Tax Paid | Tax Assessment Tax Assessment Total Assessment is a certain percentage of the fair market value that is determined by local assessors to be the total taxable value of land and additions on the property. | Land | Improvement |
|---|---|---|---|---|
| 2025 | $10,207 | $490,143 | $400,000 | $90,143 |
| 2024 | $10,207 | $487,844 | $400,000 | $87,844 |
| 2023 | $10,207 | $449,570 | $360,000 | $89,570 |
| 2022 | $9,606 | $436,270 | $373,500 | $62,770 |
| 2021 | $10,053 | $431,344 | $360,000 | $71,344 |
| 2020 | $10,731 | $443,147 | $400,000 | $43,147 |
| 2019 | $10,628 | $464,668 | $400,000 | $64,668 |
| 2018 | $9,662 | $381,845 | $320,000 | $61,845 |
| 2017 | $9,655 | $381,845 | $320,000 | $61,845 |
| 2016 | $9,655 | $381,845 | $320,000 | $61,845 |
| 2015 | $8,452 | $361,845 | $300,000 | $61,845 |
| 2014 | $8,452 | $328,788 | $270,000 | $58,788 |
Source: Public Records
Map
Nearby Homes