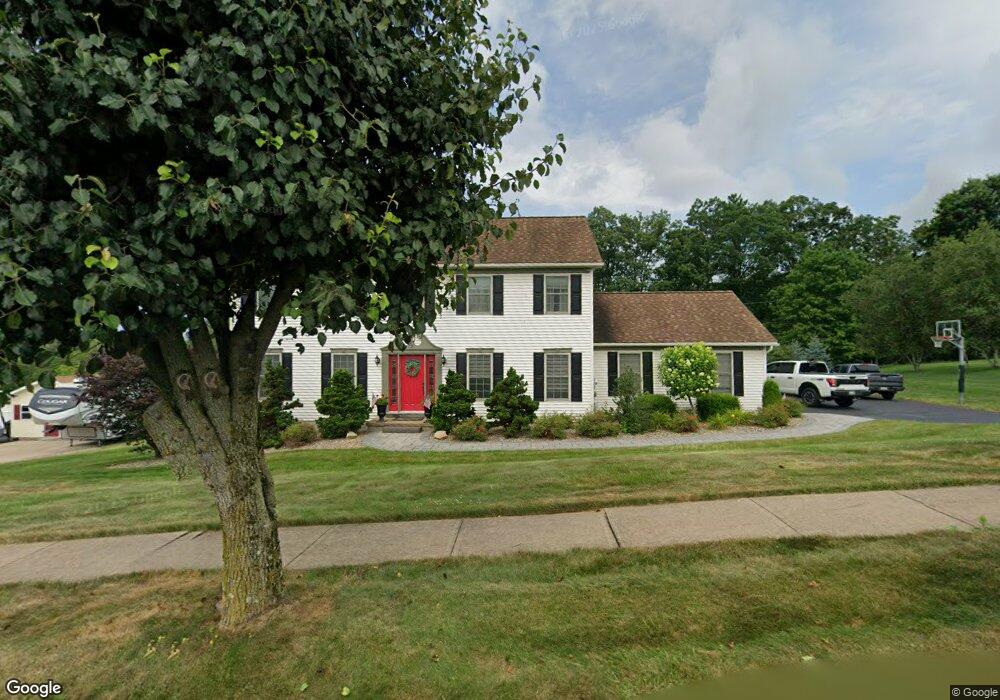
73 Brentwood Cir Bloomsburg, PA 17815
Estimated Value: $339,010 - $556,000
--
Bed
--
Bath
2,520
Sq Ft
$189/Sq Ft
Est. Value
About This Home
This home is located at 73 Brentwood Cir, Bloomsburg, PA 17815 and is currently estimated at $477,253, approximately $189 per square foot. 73 Brentwood Cir is a home located in Columbia County with nearby schools including Central Columbia Elementary School, Central Columbia Middle School, and Central Columbia Senior High School.
Ownership History
Date
Name
Owned For
Owner Type
Purchase Details
Closed on
Aug 2, 2017
Sold by
Lock Darrell M and Lock Amanda E
Bought by
Zeisloft Jeffrey G and Zeisloft Carrie L
Current Estimated Value
Purchase Details
Closed on
Dec 30, 2010
Sold by
Piotrowski Peter and Piotrowski Kellie
Bought by
Lock Darrell M and Lock Amanda E
Home Financials for this Owner
Home Financials are based on the most recent Mortgage that was taken out on this home.
Original Mortgage
$272,000
Interest Rate
4.46%
Mortgage Type
New Conventional
Purchase Details
Closed on
Mar 16, 2009
Sold by
Prats Jaime L and Prats Melanie A
Bought by
Piotrowski Peter and Piotrowski Kellie
Home Financials for this Owner
Home Financials are based on the most recent Mortgage that was taken out on this home.
Original Mortgage
$265,050
Interest Rate
4.92%
Mortgage Type
New Conventional
Create a Home Valuation Report for This Property
The Home Valuation Report is an in-depth analysis detailing your home's value as well as a comparison with similar homes in the area
Home Values in the Area
Average Home Value in this Area
Purchase History
| Date | Buyer | Sale Price | Title Company |
|---|---|---|---|
| Zeisloft Jeffrey G | $315,000 | Attorney | |
| Lock Darrell M | $292,000 | None Available | |
| Piotrowski Peter | $279,000 | None Available |
Source: Public Records
Mortgage History
| Date | Status | Borrower | Loan Amount |
|---|---|---|---|
| Previous Owner | Lock Darrell M | $272,000 | |
| Previous Owner | Piotrowski Peter | $265,050 |
Source: Public Records
Tax History Compared to Growth
Tax History
| Year | Tax Paid | Tax Assessment Tax Assessment Total Assessment is a certain percentage of the fair market value that is determined by local assessors to be the total taxable value of land and additions on the property. | Land | Improvement |
|---|---|---|---|---|
| 2025 | $4,616 | $66,345 | $0 | $0 |
| 2024 | $4,502 | $66,346 | $10,979 | $55,367 |
| 2023 | $4,303 | $66,346 | $10,979 | $55,367 |
| 2022 | $4,223 | $66,346 | $10,979 | $55,367 |
| 2021 | $4,187 | $66,346 | $10,979 | $55,367 |
| 2020 | $4,043 | $66,346 | $10,979 | $55,367 |
| 2019 | $3,960 | $66,346 | $10,979 | $55,367 |
| 2018 | $3,947 | $66,346 | $10,979 | $55,367 |
| 2017 | $4,523 | $66,346 | $10,979 | $55,367 |
| 2016 | -- | $66,346 | $10,979 | $55,367 |
| 2015 | -- | $66,346 | $10,979 | $55,367 |
| 2014 | -- | $66,346 | $10,979 | $55,367 |
Source: Public Records
Map
Nearby Homes
- 63 Brentwood Cir
- 135 Ash St
- 107 E Pebble Ln
- 139 Rotary St
- 34 Fowlersville Rd
- 14 Fowlersville Rd
- 21 Levi St
- 568 Beilys Rd
- 0 Alliance Park Dr
- 0 Alliance Park Lot 6 Dr
- LOT #3 Sawmill Rd
- 53 Fox Hollow Rd
- 238 Horse Farm Rd
- 9 Crestmont Cir
- 56 Whitmire Rd
- 11 Amanda Dr
- 407 Main St
- 2882 Lackawanna Ave
- 1246 Cherry St
- 1251 Chestnut St
- 71 Brentwood Cir
- 75 Brentwood Cir
- 70 Brentwood Cir
- 77 Brentwood Cir
- 68 Brentwood Cir
- 72 Brentwood Cir
- 69 Brentwood Cir
- 79 Brentwood Cir
- 64 Brentwood Cir
- 74 Brentwood Cir
- 62 Brentwood Cir
- 67 Brentwood Cir
- 81 Brentwood Cir
- 60 Brentwood Cir
- 65 Brentwood Cir
- 76 Brentwood Cir
- 61 Brentwood Cir
- 83 Brentwood Cir
- 61 Draketown Rd
- 58 Brentwood Cir