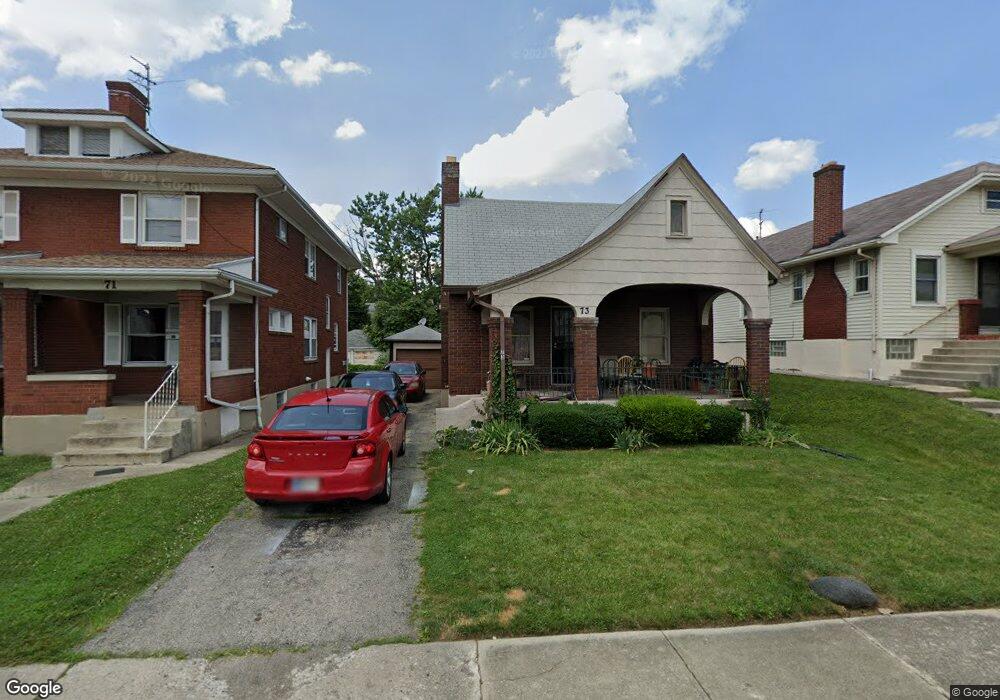
73 E Hillcrest Ave Dayton, OH 45405
North Riverdale NeighborhoodEstimated Value: $83,748 - $127,000
2
Beds
1
Bath
1,152
Sq Ft
$88/Sq Ft
Est. Value
About This Home
This home is located at 73 E Hillcrest Ave, Dayton, OH 45405 and is currently estimated at $101,437, approximately $88 per square foot. 73 E Hillcrest Ave is a home located in Montgomery County with nearby schools including Valerie Elementary School, Deca Prep, and Horizon Science Academy-Dayton Elementary School.
Ownership History
Date
Name
Owned For
Owner Type
Purchase Details
Closed on
Jul 19, 2006
Sold by
Scharff Jeff and Scharff Joni
Bought by
Lander Dianne
Current Estimated Value
Home Financials for this Owner
Home Financials are based on the most recent Mortgage that was taken out on this home.
Original Mortgage
$3,995
Outstanding Balance
$2,395
Interest Rate
6.73%
Mortgage Type
Unknown
Estimated Equity
$99,042
Purchase Details
Closed on
Mar 27, 2006
Sold by
Hud
Bought by
Scharff Jeff and Scharff Joni
Purchase Details
Closed on
Jan 26, 2006
Sold by
Wells Fargo Bank Na
Bought by
Hud
Purchase Details
Closed on
Jan 3, 2005
Sold by
Goodman Tammy L
Bought by
Wells Fargo Bank Na
Purchase Details
Closed on
Jun 26, 1997
Sold by
Wallace Charles R and Wallace Mary Ann
Bought by
Goodman Tammy L
Purchase Details
Closed on
Nov 4, 1993
Sold by
Wallace Mary Ann and Rath Mary Ann
Bought by
Wallace Charles R and Wallace Mary Ann
Create a Home Valuation Report for This Property
The Home Valuation Report is an in-depth analysis detailing your home's value as well as a comparison with similar homes in the area
Home Values in the Area
Average Home Value in this Area
Purchase History
| Date | Buyer | Sale Price | Title Company |
|---|---|---|---|
| Lander Dianne | $79,900 | None Available | |
| Scharff Jeff | $24,000 | Lakeside Title & Escrow Agen | |
| Hud | -- | None Available | |
| Hud | -- | None Available | |
| Wells Fargo Bank Na | $36,000 | -- | |
| Goodman Tammy L | $53,800 | Landmark Title | |
| Wallace Charles R | -- | Landmark Title |
Source: Public Records
Mortgage History
| Date | Status | Borrower | Loan Amount |
|---|---|---|---|
| Open | Lander Dianne | $3,995 | |
| Open | Lander Dianne | $67,915 |
Source: Public Records
Tax History Compared to Growth
Tax History
| Year | Tax Paid | Tax Assessment Tax Assessment Total Assessment is a certain percentage of the fair market value that is determined by local assessors to be the total taxable value of land and additions on the property. | Land | Improvement |
|---|---|---|---|---|
| 2024 | $452 | $16,910 | $3,970 | $12,940 |
| 2023 | $452 | $16,910 | $3,970 | $12,940 |
| 2022 | $280 | $12,340 | $2,900 | $9,440 |
| 2021 | $279 | $12,340 | $2,900 | $9,440 |
| 2020 | $278 | $12,340 | $2,900 | $9,440 |
| 2019 | $353 | $12,700 | $2,900 | $9,800 |
| 2018 | $353 | $12,700 | $2,900 | $9,800 |
| 2017 | $351 | $12,700 | $2,900 | $9,800 |
| 2016 | $503 | $14,380 | $2,900 | $11,480 |
| 2015 | $478 | $14,380 | $2,900 | $11,480 |
| 2014 | $478 | $14,380 | $2,900 | $11,480 |
| 2012 | -- | $16,840 | $4,330 | $12,510 |
Source: Public Records
Map
Nearby Homes
- 69 E Beechwood Ave
- 53 E Beechwood Ave
- 2808 N Main St
- 156 E Hillcrest Ave
- 78 Pointview Ave
- 75 Pointview Ave
- 73 Pointview Ave
- 148 Basswood Ave
- 2921 N Main St
- 49 Pointview Ave
- 212 E Hillcrest Ave
- 29 Laura Ave
- 233 Pointview Ave
- 212 E Beechwood Ave
- 52 Fernwood Ave
- 324 E Maplewood Ave
- 11 Pinehurst Ave
- 124 Knecht Dr
- 25 Cliff St Unit 23
- 121 Marson Dr
- 71 E Hillcrest Ave
- 69 E Hillcrest Ave
- 77 E Hillcrest Ave
- 65 E Hillcrest Ave
- 81 E Hillcrest Ave
- 101 E Hillcrest Ave
- 61 E Hillcrest Ave
- 106 E Maplewood Ave
- 108 E Maplewood Ave
- 86 E Maplewood Ave
- 57 E Hillcrest Ave
- 105 E Hillcrest Ave
- 112 E Maplewood Ave
- 80 E Maplewood Ave
- 76 E Hillcrest Ave
- 70 E Hillcrest Ave
- 82 E Hillcrest Ave
- 66 E Hillcrest Ave
- 118 E Maplewood Ave
- 76 E Maplewood Ave