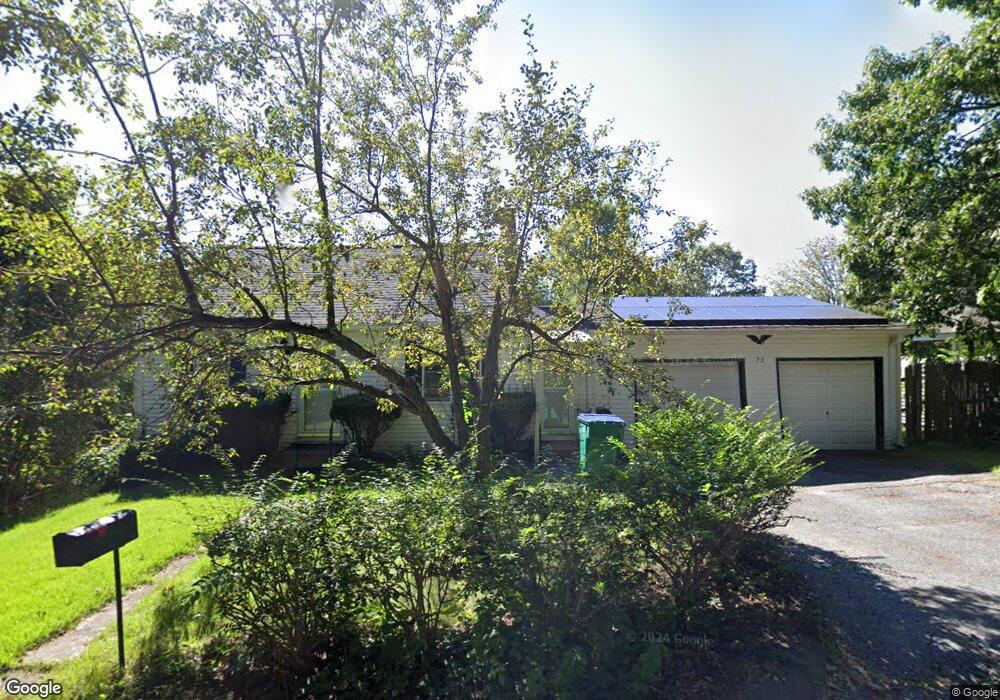
73 E Prospect St Fitchburg, MA 01420
Estimated Value: $365,585 - $419,000
3
Beds
1
Bath
1,208
Sq Ft
$321/Sq Ft
Est. Value
About This Home
This home is located at 73 E Prospect St, Fitchburg, MA 01420 and is currently estimated at $387,896, approximately $321 per square foot. 73 E Prospect St is a home located in Worcester County with nearby schools including Crocker Elementary School, South Street Elementary School, and Fitchburg High School.
Ownership History
Date
Name
Owned For
Owner Type
Purchase Details
Closed on
Jun 30, 1997
Sold by
Chouinard Judith A and Willingham Susan J
Bought by
Regan Michael A and Regan Lori Ann
Current Estimated Value
Home Financials for this Owner
Home Financials are based on the most recent Mortgage that was taken out on this home.
Original Mortgage
$73,000
Interest Rate
7.81%
Mortgage Type
Purchase Money Mortgage
Create a Home Valuation Report for This Property
The Home Valuation Report is an in-depth analysis detailing your home's value as well as a comparison with similar homes in the area
Home Values in the Area
Average Home Value in this Area
Purchase History
| Date | Buyer | Sale Price | Title Company |
|---|---|---|---|
| Regan Michael A | $102,000 | -- |
Source: Public Records
Mortgage History
| Date | Status | Borrower | Loan Amount |
|---|---|---|---|
| Open | Regan Michael A | $27,400 | |
| Open | Regan Michael A | $76,500 | |
| Closed | Regan Michael A | $73,000 |
Source: Public Records
Tax History Compared to Growth
Tax History
| Year | Tax Paid | Tax Assessment Tax Assessment Total Assessment is a certain percentage of the fair market value that is determined by local assessors to be the total taxable value of land and additions on the property. | Land | Improvement |
|---|---|---|---|---|
| 2025 | $42 | $313,500 | $101,900 | $211,600 |
| 2024 | $4,261 | $287,700 | $82,500 | $205,200 |
| 2023 | $3,994 | $249,300 | $72,900 | $176,400 |
| 2022 | $3,894 | $221,100 | $70,100 | $151,000 |
| 2021 | $4,006 | $210,500 | $66,000 | $144,500 |
| 2020 | $5,195 | $194,600 | $60,500 | $134,100 |
| 2019 | $3,522 | $171,900 | $66,000 | $105,900 |
| 2018 | $3,345 | $159,200 | $60,500 | $98,700 |
| 2017 | $3,064 | $142,600 | $56,400 | $86,200 |
| 2016 | $2,987 | $140,700 | $53,600 | $87,100 |
| 2015 | $2,808 | $135,800 | $49,500 | $86,300 |
| 2014 | $2,703 | $136,300 | $49,500 | $86,800 |
Source: Public Records
Map
Nearby Homes
- 23 Marshall Rd
- 474 Townsend St
- 855 John Fitch Hwy Unit 44
- 825 John Fitch Hwy Unit 9
- 62 Shawna St
- 288-290 Pearl St
- 137 East St
- 276 Lunenburg St Unit 50
- 665 Townsend St
- 74 East St
- 206 Highland Ave
- 55 Brier St Unit 55
- 363 Lunenburg St
- 56 Orange St
- 168 Lunenburg St
- 15 Will Thompson Way
- 9 Pleasant St
- 23 Tilton Ave
- 62 Wendell Rd
- 1 Avon Place
- 65 E Prospect St
- 65 E Prospect St Unit 1
- 83 Frederick St
- 81 E Prospect St
- 61 E Prospect St
- 95 E Prospect St
- 55 E Prospect St
- 70 Frederick St
- 97 Frederick St
- 97 E Prospect St
- 17 Fairview Ave
- 120 Marshall Rd
- 110 Marshall Rd
- 47 E Prospect St
- 88 Frederick St
- 60 Frederick St
- 94 Marshall Rd
- 124 Marshall Rd
- 138 Marshall Rd
- 84 Marshall Rd