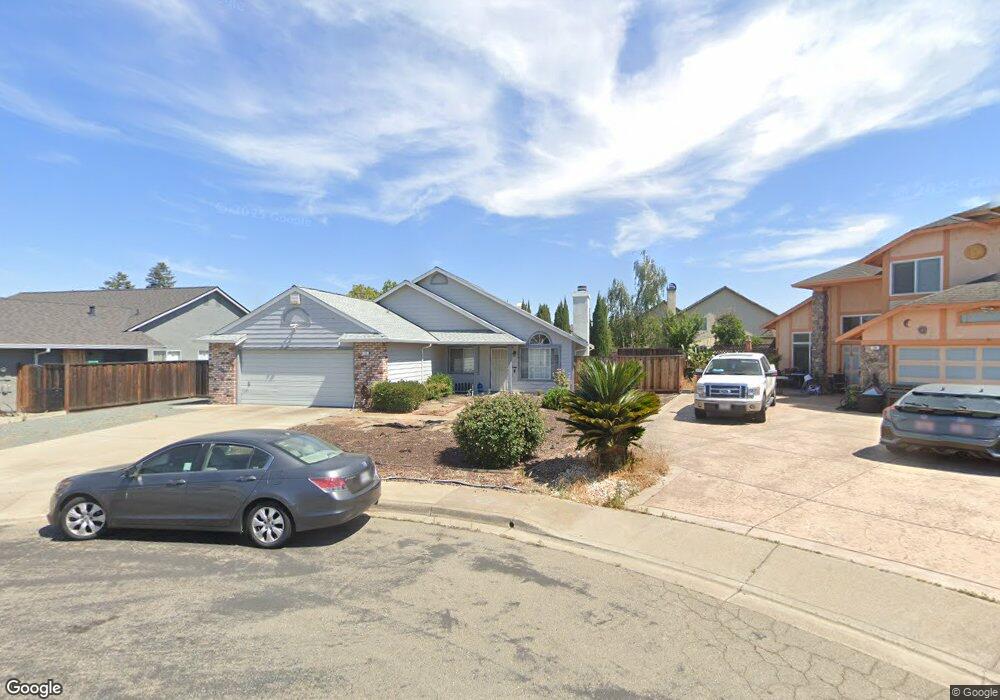
73 Ravenswood Ct Oakley, CA 94561
Estimated Value: $527,000 - $568,000
3
Beds
2
Baths
1,119
Sq Ft
$495/Sq Ft
Est. Value
About This Home
This home is located at 73 Ravenswood Ct, Oakley, CA 94561 and is currently estimated at $553,840, approximately $494 per square foot. 73 Ravenswood Ct is a home located in Contra Costa County with nearby schools including Vintage Parkway Elementary School, Delta Vista Middle School, and Freedom High School.
Ownership History
Date
Name
Owned For
Owner Type
Purchase Details
Closed on
Sep 9, 2021
Sold by
Cahatol Lynn
Bought by
Cahatol Lynn and 2021 Lynn Cahatol Revocable Tr
Current Estimated Value
Purchase Details
Closed on
Dec 5, 2017
Sold by
The Bennie Lee Jett Living Trust
Bought by
Cahatol Lynn
Home Financials for this Owner
Home Financials are based on the most recent Mortgage that was taken out on this home.
Original Mortgage
$373,450
Outstanding Balance
$314,412
Interest Rate
3.94%
Mortgage Type
New Conventional
Estimated Equity
$239,428
Purchase Details
Closed on
Aug 16, 2006
Sold by
Jett Bennie L
Bought by
The Bennie Lee Jett Living Trust
Purchase Details
Closed on
Sep 24, 1997
Sold by
Ascarrunz Dillma G and Ascarrunz Dillma G
Bought by
Jett Bennie L
Home Financials for this Owner
Home Financials are based on the most recent Mortgage that was taken out on this home.
Original Mortgage
$77,000
Interest Rate
7.54%
Mortgage Type
Purchase Money Mortgage
Create a Home Valuation Report for This Property
The Home Valuation Report is an in-depth analysis detailing your home's value as well as a comparison with similar homes in the area
Home Values in the Area
Average Home Value in this Area
Purchase History
| Date | Buyer | Sale Price | Title Company |
|---|---|---|---|
| Cahatol Lynn | -- | None Available | |
| Cahatol Lynn | $385,000 | Old Republic Title Company | |
| The Bennie Lee Jett Living Trust | -- | None Available | |
| Jett Bennie L | $128,000 | North American Title Co |
Source: Public Records
Mortgage History
| Date | Status | Borrower | Loan Amount |
|---|---|---|---|
| Open | Cahatol Lynn | $373,450 | |
| Previous Owner | Jett Bennie L | $77,000 |
Source: Public Records
Tax History Compared to Growth
Tax History
| Year | Tax Paid | Tax Assessment Tax Assessment Total Assessment is a certain percentage of the fair market value that is determined by local assessors to be the total taxable value of land and additions on the property. | Land | Improvement |
|---|---|---|---|---|
| 2025 | $5,789 | $438,060 | $193,429 | $244,631 |
| 2024 | $5,724 | $429,472 | $189,637 | $239,835 |
| 2023 | $5,724 | $421,052 | $185,919 | $235,133 |
| 2022 | $5,678 | $412,797 | $182,274 | $230,523 |
| 2021 | $5,590 | $404,703 | $178,700 | $226,003 |
| 2019 | $5,322 | $392,700 | $173,400 | $219,300 |
| 2018 | $5,185 | $385,000 | $170,000 | $215,000 |
| 2017 | $1,268 | $44,096 | $20,852 | $23,244 |
| 2016 | $1,229 | $43,233 | $20,444 | $22,789 |
| 2015 | $1,231 | $42,584 | $20,137 | $22,447 |
| 2014 | $1,206 | $41,751 | $19,743 | $22,008 |
Source: Public Records
Map
Nearby Homes
- 2022 Beringer Way
- 1712 Domaine Way
- 736 Walnut Ranch Way
- 521 Freemark Ln
- 868 Diamante Way
- 1809 Teresa Ln
- 5210 Martin St
- 1859 Santa fe St
- 7 Geneseo St
- 30 Otsego St
- 59 Oneida St
- 46 Cayuga St
- 36 Cayuga St
- 99 Ottawa St
- 64 Oneida St
- 1384 Rutherford Ln
- 111 Zartop St
- 115 Montevino Ct
- 70 Oneida St
- 114 Zartop St
- 71 Ravenswood Ct
- 75 Ravenswood Ct
- 1861 Concannon Dr
- 1875 Concannon Dr
- 1855 Concannon Dr
- 77 Ravenswood Ct
- 1879 Concannon Dr
- 76 Ravenswood Ct
- 72 Ravenswood Ct
- 70 Ravenswood Ct
- 74 Ravenswood Ct
- 947 Weibel Cir
- 943 Weibel Cir
- 951 Weibel Cir
- 939 Weibel Cir
- 1876 Concannon Dr
- 1856 Concannon Dr
- 934 Weibel Cir
- 904 Almaden Cir
- 1880 Concannon Dr