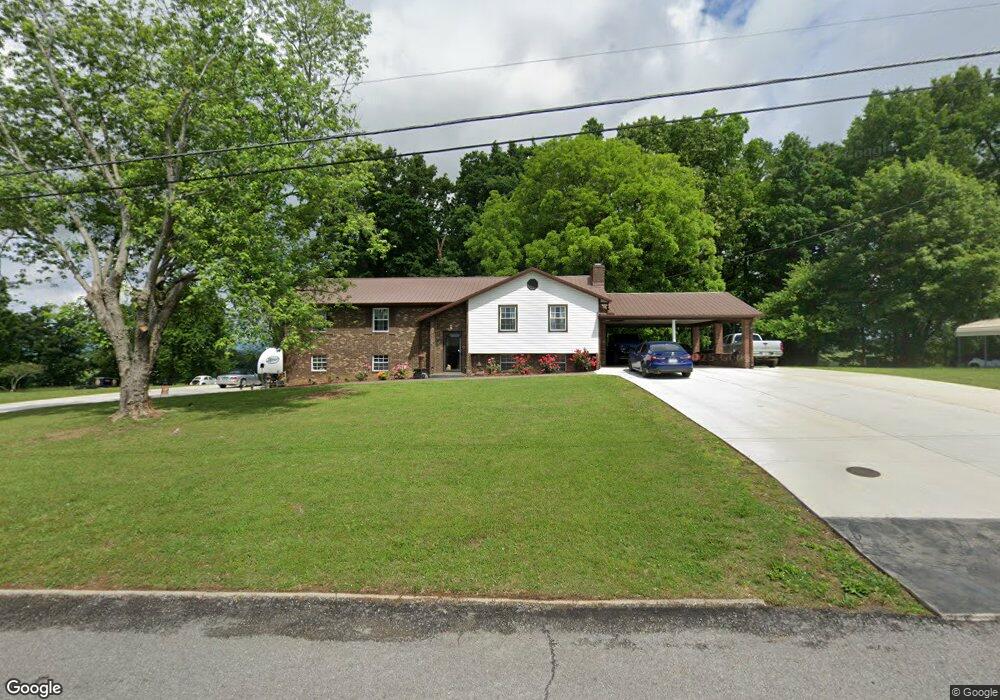
730 Harvey Dr Russellville, TN 37860
Estimated Value: $208,000 - $305,000
--
Bed
2
Baths
1,535
Sq Ft
$174/Sq Ft
Est. Value
About This Home
This home is located at 730 Harvey Dr, Russellville, TN 37860 and is currently estimated at $267,529, approximately $174 per square foot. 730 Harvey Dr is a home located in Hamblen County with nearby schools including Russellville Elementary School, East Ridge Middle School, and Morristown East High School.
Ownership History
Date
Name
Owned For
Owner Type
Purchase Details
Closed on
Jul 25, 2011
Sold by
Secretary Of Housing And U
Bought by
Legg Alvis
Current Estimated Value
Home Financials for this Owner
Home Financials are based on the most recent Mortgage that was taken out on this home.
Original Mortgage
$85,000
Outstanding Balance
$58,505
Interest Rate
4.52%
Mortgage Type
FHA
Estimated Equity
$209,024
Purchase Details
Closed on
Sep 28, 2010
Bought by
Secretary Of H U D %Pyramid Real Estate Serv
Purchase Details
Closed on
May 30, 2008
Sold by
Douglas Jones Michael
Bought by
Sharp Ricky
Home Financials for this Owner
Home Financials are based on the most recent Mortgage that was taken out on this home.
Original Mortgage
$165,242
Interest Rate
6.02%
Purchase Details
Closed on
Nov 6, 1986
Bought by
Jones Clarence H and Jones Virginia M
Create a Home Valuation Report for This Property
The Home Valuation Report is an in-depth analysis detailing your home's value as well as a comparison with similar homes in the area
Home Values in the Area
Average Home Value in this Area
Purchase History
| Date | Buyer | Sale Price | Title Company |
|---|---|---|---|
| Legg Alvis | $85,000 | -- | |
| Secretary Of H U D %Pyramid Real Estate Serv | $183,400 | -- | |
| The Secretary Of Housing And U | $183,413 | -- | |
| Sharp Ricky | $156,500 | -- | |
| Jones Clarence H | $65,000 | -- |
Source: Public Records
Mortgage History
| Date | Status | Borrower | Loan Amount |
|---|---|---|---|
| Open | Legg Alvis | $85,000 | |
| Previous Owner | Jones Clarence H | $165,242 |
Source: Public Records
Tax History Compared to Growth
Tax History
| Year | Tax Paid | Tax Assessment Tax Assessment Total Assessment is a certain percentage of the fair market value that is determined by local assessors to be the total taxable value of land and additions on the property. | Land | Improvement |
|---|---|---|---|---|
| 2024 | $773 | $39,250 | $6,000 | $33,250 |
| 2023 | $773 | $39,250 | $0 | $0 |
| 2022 | $773 | $39,250 | $6,000 | $33,250 |
| 2021 | $773 | $39,250 | $6,000 | $33,250 |
| 2020 | $773 | $39,250 | $6,000 | $33,250 |
| 2019 | $745 | $34,975 | $6,950 | $28,025 |
| 2018 | $745 | $34,975 | $6,950 | $28,025 |
| 2017 | $745 | $34,975 | $6,950 | $28,025 |
| 2016 | $696 | $34,975 | $6,950 | $28,025 |
| 2015 | $647 | $34,975 | $6,950 | $28,025 |
| 2014 | -- | $34,975 | $6,950 | $28,025 |
| 2013 | -- | $39,550 | $0 | $0 |
Source: Public Records
Map
Nearby Homes
- 770 Harvey Dr
- 505 Mary St
- 233 Harvey Dr
- 354 Volunteer Dr
- 5740 Dodson Ferry Rd
- 5790 N 2nd St
- 5085 Old Kentucky Rd
- 5659 Browning Way
- 1708 Boardwalk Cir
- 5556 Denton Dr
- 6284 Old Russellville Pike
- 6330 Old Russellville Pike
- 6421 Old Russellville Pike
- 4475 Copeland Dr
- 4561 Birchwood Cir
- 4907 Barton Springs Dr
- 5110 Anne Cir
- 00 Shinbone E Sugar Hollow Rd
- 288 Fuller Estate Cir
- 2551 Cedar Creek Rd