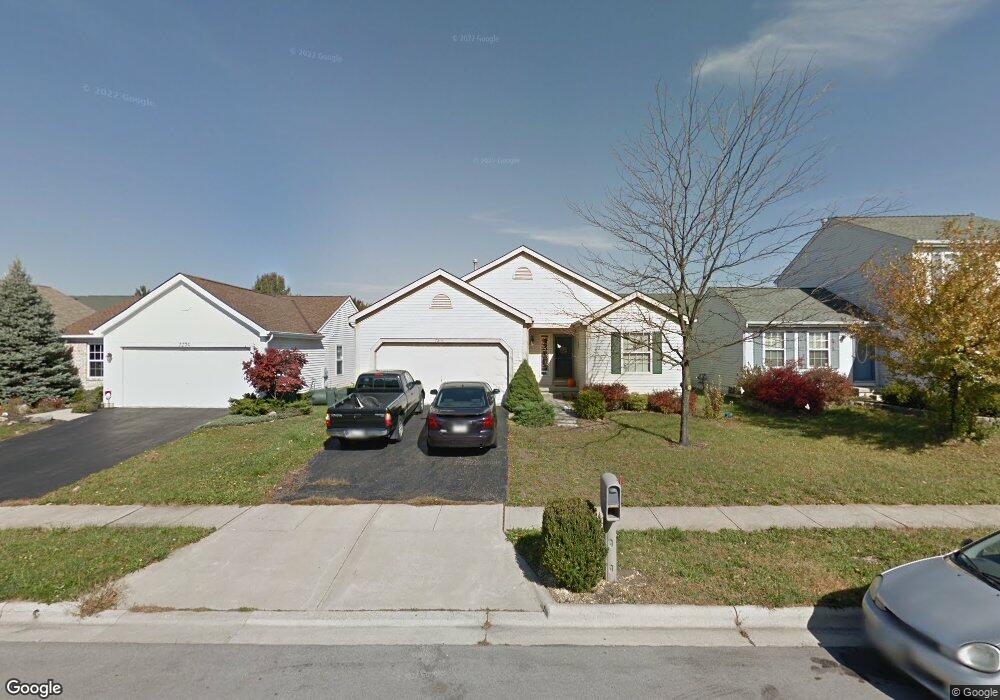
7300 Aplin Dr Reynoldsburg, OH 43068
Estimated Value: $276,000 - $291,000
3
Beds
2
Baths
1,272
Sq Ft
$224/Sq Ft
Est. Value
About This Home
This home is located at 7300 Aplin Dr, Reynoldsburg, OH 43068 and is currently estimated at $284,934, approximately $224 per square foot. 7300 Aplin Dr is a home located in Fairfield County with nearby schools including Tussing Elementary School, Harmon Middle School, and Pickerington Ridgeview Junior High School.
Ownership History
Date
Name
Owned For
Owner Type
Purchase Details
Closed on
Nov 18, 2020
Sold by
Kovacs Camille and Browning Camille
Bought by
Kovacs Samuel
Current Estimated Value
Purchase Details
Closed on
Feb 17, 2010
Sold by
Secretary Of Housing & Urban Development
Bought by
Kovacs Camille
Purchase Details
Closed on
Nov 19, 2009
Sold by
Meares Donald P and Case #2008 Cv 1530
Bought by
The Bank Of New York Mellon and The Bank Of New York
Purchase Details
Closed on
Sep 24, 2009
Sold by
The Bank Of New York Mellon
Bought by
Secretary Of Housing & Urban Development
Purchase Details
Closed on
Jun 26, 1998
Sold by
M/I Schottenstein Homes
Bought by
Meares Donald P and Meares Amy N
Home Financials for this Owner
Home Financials are based on the most recent Mortgage that was taken out on this home.
Original Mortgage
$118,678
Interest Rate
7.27%
Mortgage Type
FHA
Create a Home Valuation Report for This Property
The Home Valuation Report is an in-depth analysis detailing your home's value as well as a comparison with similar homes in the area
Home Values in the Area
Average Home Value in this Area
Purchase History
| Date | Buyer | Sale Price | Title Company |
|---|---|---|---|
| Kovacs Samuel | $146,400 | None Available | |
| Kovacs Camille | $87,510 | World Class Title | |
| The Bank Of New York Mellon | $82,000 | None Available | |
| Secretary Of Housing & Urban Development | -- | None Available | |
| Meares Donald P | $122,250 | -- |
Source: Public Records
Mortgage History
| Date | Status | Borrower | Loan Amount |
|---|---|---|---|
| Previous Owner | Meares Donald P | $118,678 |
Source: Public Records
Tax History Compared to Growth
Tax History
| Year | Tax Paid | Tax Assessment Tax Assessment Total Assessment is a certain percentage of the fair market value that is determined by local assessors to be the total taxable value of land and additions on the property. | Land | Improvement |
|---|---|---|---|---|
| 2024 | $6,574 | $66,770 | $10,920 | $55,850 |
| 2023 | $2,598 | $66,770 | $10,920 | $55,850 |
| 2022 | $2,604 | $66,770 | $10,920 | $55,850 |
| 2021 | $2,314 | $51,220 | $8,400 | $42,820 |
| 2020 | $2,323 | $51,220 | $8,400 | $42,820 |
| 2019 | $2,357 | $51,220 | $8,400 | $42,820 |
| 2018 | $1,957 | $38,430 | $7,700 | $30,730 |
| 2017 | $1,959 | $37,570 | $7,000 | $30,570 |
| 2016 | $1,944 | $37,570 | $7,000 | $30,570 |
| 2015 | $1,860 | $34,170 | $7,000 | $27,170 |
| 2014 | $1,831 | $34,170 | $7,000 | $27,170 |
| 2013 | $1,831 | $34,170 | $7,000 | $27,170 |
Source: Public Records
Map
Nearby Homes
- 7350 Aplin Dr
- 3021 Sumner Dr
- 3212 Southern Hills Dr
- 2909 Princeville Dr
- 3161 Innisbrook Ct
- 3099 Ambarwent Rd
- 2916 Princeville Dr
- 3205 Mahaffey Ct
- 3233 Mahaffey Ct
- 2961 Stone Mountain Dr
- 2968 Stone Mountain Dr
- 7619 Kittansett Ln
- 7611 Bay Hill Dr
- 7640 Kittansett Ln
- 3088 Alderbrook Dr
- 3072 Bocastle Ct
- 7659 Howell Park Dr
- 3077 Highland Park Dr
- 3139 Highland Park Dr
- 7700 Eagle Creek Dr