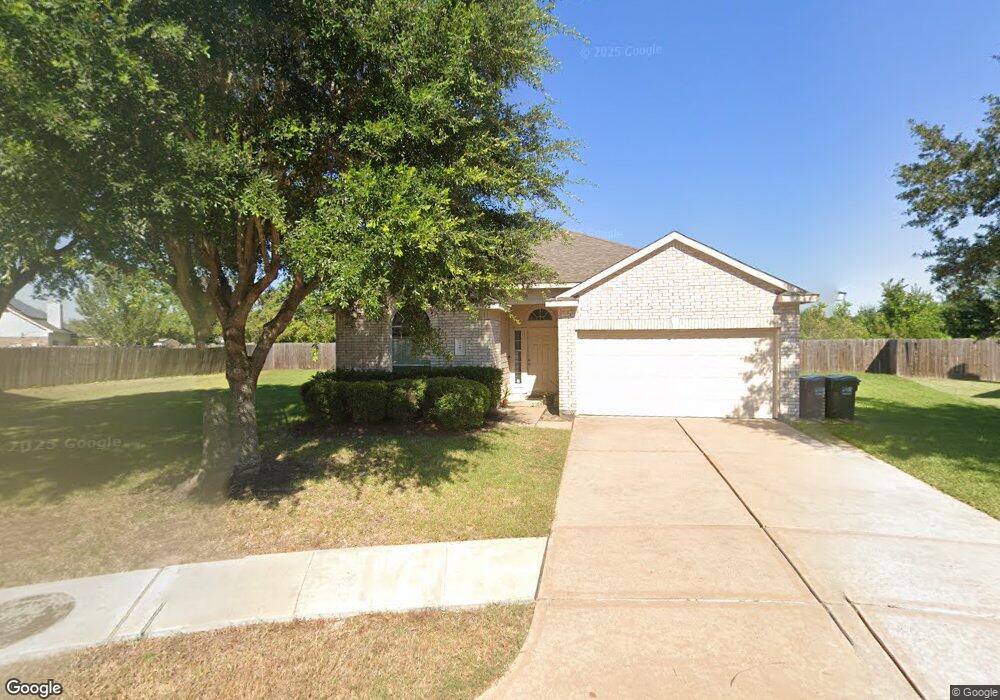
7301 Shade Ct Pearland, TX 77584
Estimated Value: $308,000 - $327,000
3
Beds
2
Baths
1,868
Sq Ft
$169/Sq Ft
Est. Value
About This Home
This home is located at 7301 Shade Ct, Pearland, TX 77584 and is currently estimated at $315,049, approximately $168 per square foot. 7301 Shade Ct is a home located in Brazoria County with nearby schools including H.C. Carleston Elementary School, Sam Jamison Middle School, and Pearland Junior High School South.
Ownership History
Date
Name
Owned For
Owner Type
Purchase Details
Closed on
May 14, 2014
Sold by
The Secretary Of Hud
Bought by
Marroquin Jorge and Marroquin Rosa M
Current Estimated Value
Home Financials for this Owner
Home Financials are based on the most recent Mortgage that was taken out on this home.
Original Mortgage
$142,373
Outstanding Balance
$109,191
Interest Rate
4.5%
Mortgage Type
FHA
Estimated Equity
$205,858
Purchase Details
Closed on
Aug 9, 2013
Sold by
Wells Fargo Bank Na
Bought by
The Secretary Of Hud
Purchase Details
Closed on
Aug 6, 2013
Sold by
Lawrence John Reynard and Lawrence Patti Ann
Bought by
Wells Fargo Bank Na
Purchase Details
Closed on
Sep 18, 2006
Sold by
D R Horton Texas Ltd
Bought by
Lawrence John Reynard and Lawrence Patti Ann
Home Financials for this Owner
Home Financials are based on the most recent Mortgage that was taken out on this home.
Original Mortgage
$155,353
Interest Rate
6.55%
Mortgage Type
FHA
Create a Home Valuation Report for This Property
The Home Valuation Report is an in-depth analysis detailing your home's value as well as a comparison with similar homes in the area
Home Values in the Area
Average Home Value in this Area
Purchase History
| Date | Buyer | Sale Price | Title Company |
|---|---|---|---|
| Marroquin Jorge | -- | Stewart Title | |
| The Secretary Of Hud | -- | None Available | |
| Wells Fargo Bank Na | $179,493 | None Available | |
| Lawrence John Reynard | -- | None Available |
Source: Public Records
Mortgage History
| Date | Status | Borrower | Loan Amount |
|---|---|---|---|
| Open | Marroquin Jorge | $142,373 | |
| Previous Owner | Lawrence John Reynard | $155,353 |
Source: Public Records
Tax History Compared to Growth
Tax History
| Year | Tax Paid | Tax Assessment Tax Assessment Total Assessment is a certain percentage of the fair market value that is determined by local assessors to be the total taxable value of land and additions on the property. | Land | Improvement |
|---|---|---|---|---|
| 2025 | $5,602 | $290,900 | $36,030 | $254,870 |
| 2023 | $5,602 | $267,784 | $36,030 | $279,040 |
| 2022 | $6,586 | $243,440 | $36,030 | $207,410 |
| 2021 | $6,666 | $228,570 | $32,760 | $195,810 |
| 2020 | $6,691 | $222,310 | $32,760 | $189,550 |
| 2019 | $6,124 | $198,910 | $32,760 | $166,150 |
| 2018 | $5,996 | $195,520 | $32,760 | $162,760 |
| 2017 | $5,922 | $190,400 | $32,760 | $157,640 |
| 2016 | $5,860 | $190,400 | $32,760 | $157,640 |
| 2014 | $5,359 | $162,270 | $32,760 | $129,510 |
Source: Public Records
Map
Nearby Homes
- 2526 Oak Rd
- 2534 Oak Rd
- 9.6 AC Fite Rd
- 7333 Fite Rd
- 6806 Adella Ct
- 3402 Windmill Palm Dr
- 4915 Pecan Grove Dr
- 1 Farm To Market 1128
- 2826 Foxden Dr
- 7123 Elgin St
- 2811 Afton Dr
- 4811 Meadowglen Dr
- 3304 Autumn Forest Dr
- 6816 Broadway St
- 3638 Manvel Rd
- 4622 Pecan Grove Dr
- 2815 Abbey Field Dr
- 4838 Pinder Ln
- 3506 Windmill Palm Dr
- 4527 Brookren Ct
- 7303 Shade Ct
- 7302 Shade Ct
- 7304 Newport Ln
- 7302 Newport Ln
- 7305 Shade Ct
- 7304 Shade Ct
- 7306 Shade Ct
- 7306 Newport Ln
- 7307 Shade Ct
- 7303 Stonelick Ct
- 7308 Shade Ct
- 7308 Newport Ln
- 7301 Newport Ln
- 7301 Stonelick Ct
- 7309 Shade Ct
- 7303 Newport Ln
- 7310 Newport Ln
- 7307 Stonelick Ct
- 7305 Newport Ln
- 7307 Newport Ln