Estimated Value: $328,000 - $399,000
3
Beds
2
Baths
2,095
Sq Ft
$177/Sq Ft
Est. Value
About This Home
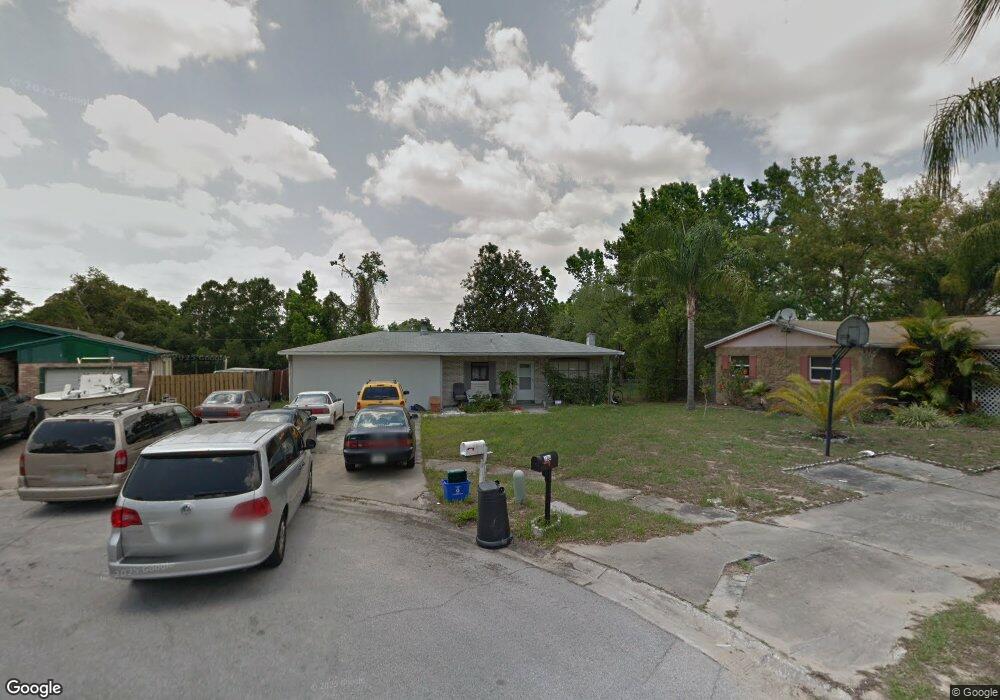
This home is located at 7302 Willow Park Dr, Tampa, FL 33637 and is currently estimated at $371,127, approximately $177 per square foot. 7302 Willow Park Dr is a home located in Hillsborough County with nearby schools including Folsom Elementary School, Greco Middle School, and King High School.
Ownership History
Date
Name
Owned For
Owner Type
Purchase Details
Closed on
Oct 16, 2009
Sold by
Hsbc Bank Usa National Association
Bought by
Chau Yan Yang
Current Estimated Value
Purchase Details
Closed on
Jun 29, 2009
Sold by
Mccants Byron B and Mccants Linda
Bought by
Hsbc Bank Usa National Association
Purchase Details
Closed on
Sep 22, 2005
Sold by
Morgan Haidee A
Bought by
Mccants Byron B and Mccants Linda
Home Financials for this Owner
Home Financials are based on the most recent Mortgage that was taken out on this home.
Original Mortgage
$158,525
Interest Rate
7.6%
Mortgage Type
Fannie Mae Freddie Mac
Purchase Details
Closed on
May 14, 1996
Sold by
Davis James N
Bought by
Morgan Haidee A
Home Financials for this Owner
Home Financials are based on the most recent Mortgage that was taken out on this home.
Original Mortgage
$58,691
Interest Rate
7.67%
Mortgage Type
FHA
Purchase Details
Closed on
Jan 2, 1996
Sold by
Dewey Michael H and Dewey F
Bought by
Davis James N
Create a Home Valuation Report for This Property
The Home Valuation Report is an in-depth analysis detailing your home's value as well as a comparison with similar homes in the area
Home Values in the Area
Average Home Value in this Area
Purchase History
| Date | Buyer | Sale Price | Title Company |
|---|---|---|---|
| Chau Yan Yang | $60,000 | None Available | |
| Hsbc Bank Usa National Association | -- | None Available | |
| Mccants Byron B | $186,500 | Pan American Title Company | |
| Morgan Haidee A | $59,000 | -- | |
| Davis James N | $7,400 | -- |
Source: Public Records
Mortgage History
| Date | Status | Borrower | Loan Amount |
|---|---|---|---|
| Previous Owner | Mccants Byron B | $158,525 | |
| Previous Owner | Davis James N | $58,691 |
Source: Public Records
Tax History Compared to Growth
Tax History
| Year | Tax Paid | Tax Assessment Tax Assessment Total Assessment is a certain percentage of the fair market value that is determined by local assessors to be the total taxable value of land and additions on the property. | Land | Improvement |
|---|---|---|---|---|
| 2024 | $4,664 | $282,447 | $83,029 | $199,418 |
| 2023 | $4,183 | $240,681 | $74,726 | $165,955 |
| 2022 | $4,016 | $262,023 | $70,575 | $191,448 |
| 2021 | $3,485 | $189,139 | $49,817 | $139,322 |
| 2020 | $3,165 | $170,839 | $41,515 | $129,324 |
| 2019 | $2,916 | $159,711 | $41,515 | $118,196 |
| 2018 | $2,715 | $149,322 | $0 | $0 |
| 2017 | $2,429 | $121,859 | $0 | $0 |
| 2016 | $2,219 | $97,431 | $0 | $0 |
| 2015 | $2,050 | $88,574 | $0 | $0 |
| 2014 | $1,917 | $80,522 | $0 | $0 |
| 2013 | -- | $73,202 | $0 | $0 |
Source: Public Records
Map
Nearby Homes
- 7106 Lynwood Dr
- 7316 Willow Park Dr
- 7025 Allview Dr
- 8309 Tupelo Dr
- 8211 Broward Place
- 8416 Tupelo Dr
- 8407 Caladesi Island Dr
- 8406 Renald Blvd
- 7515 Wakulla Dr
- 8508 Tupelo Dr
- 7502 Gadsden Dr
- 7705 Willow Park Dr Unit IIB
- 7712 Willow Park Dr
- 7715 Gulf Ct
- 7425 Terrace River Dr
- 8801 Chinaberry Dr
- 7419 Savannah Ln
- 7613 S Sanibel Cir
- 616 Vanderbaker Rd
- 7703 Robert e Lee Rd
- 7304 Willow Park Dr
- 7301 Willow Park Dr
- 7014 Lynwood Dr
- 7016 Lynwood Dr
- 8302 Temple Park Dr
- 7012 Lynwood Dr
- 7303 Willow Park Dr
- 8304 Temple Park Dr
- 7019 Sarvis St
- 7017 Sarvis St
- 7021 Sarvis St
- 7018 Lynwood Dr
- 7015 Sarvis St
- 7305 Willow Park Dr
- 8324 Temple Park Dr
- 7013 Sarvis St
- 7307 Willow Park Dr
- 7010 Lynwood Dr
- 7009 Lynwood Dr
- 7104 Lynwood Dr