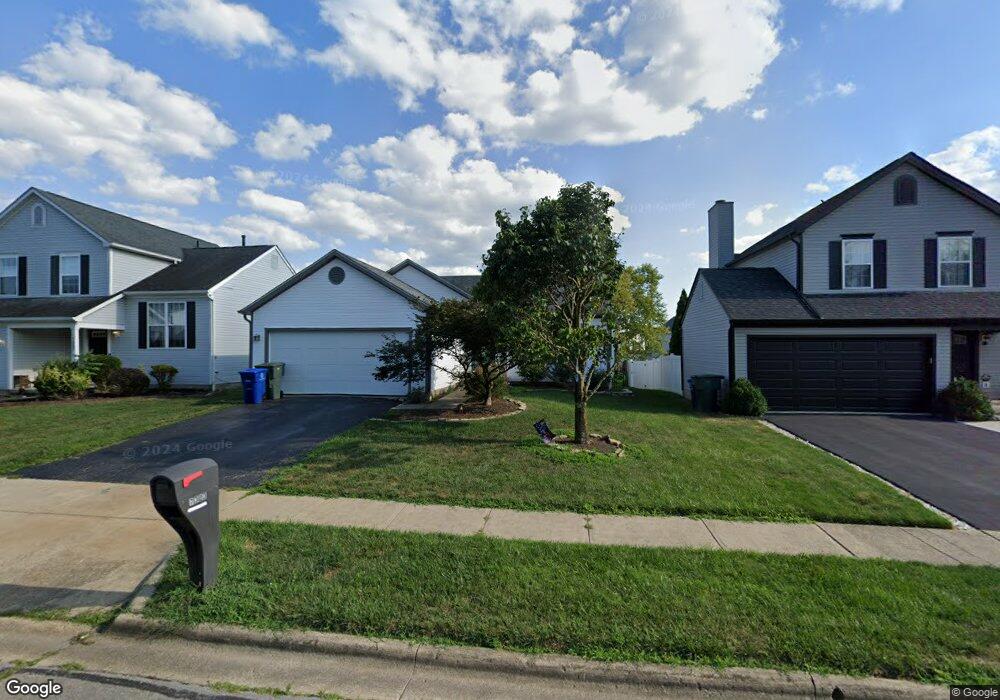
7303 Arborlee Dr Reynoldsburg, OH 43068
Estimated Value: $286,000 - $294,000
3
Beds
2
Baths
1,216
Sq Ft
$239/Sq Ft
Est. Value
About This Home
This home is located at 7303 Arborlee Dr, Reynoldsburg, OH 43068 and is currently estimated at $290,157, approximately $238 per square foot. 7303 Arborlee Dr is a home located in Fairfield County with nearby schools including Tussing Elementary School, Harmon Middle School, and Pickerington Ridgeview Junior High School.
Ownership History
Date
Name
Owned For
Owner Type
Purchase Details
Closed on
Jan 21, 2015
Sold by
Grant William T and Grant Cheryl G
Bought by
Nay Terryn C
Current Estimated Value
Home Financials for this Owner
Home Financials are based on the most recent Mortgage that was taken out on this home.
Original Mortgage
$119,047
Interest Rate
3.75%
Mortgage Type
FHA
Purchase Details
Closed on
Jul 18, 2000
Sold by
Emmerling Donald R
Bought by
Grant William T and Grant Cheryl G
Purchase Details
Closed on
Aug 22, 1995
Sold by
Borror Corp
Bought by
Donald R Emmerling
Home Financials for this Owner
Home Financials are based on the most recent Mortgage that was taken out on this home.
Original Mortgage
$107,288
Interest Rate
7.64%
Mortgage Type
FHA
Purchase Details
Closed on
Feb 23, 1995
Sold by
Borror Realty Co
Bought by
Borror Corp
Create a Home Valuation Report for This Property
The Home Valuation Report is an in-depth analysis detailing your home's value as well as a comparison with similar homes in the area
Home Values in the Area
Average Home Value in this Area
Purchase History
| Date | Buyer | Sale Price | Title Company |
|---|---|---|---|
| Nay Terryn C | $126,000 | Attorney | |
| Grant William T | $106,139 | -- | |
| Donald R Emmerling | $109,675 | -- | |
| Borror Corp | $333,838 | -- |
Source: Public Records
Mortgage History
| Date | Status | Borrower | Loan Amount |
|---|---|---|---|
| Previous Owner | Nay Terryn C | $119,047 | |
| Previous Owner | Donald R Emmerling | $107,288 | |
| Closed | Grant William T | $0 |
Source: Public Records
Tax History Compared to Growth
Tax History
| Year | Tax Paid | Tax Assessment Tax Assessment Total Assessment is a certain percentage of the fair market value that is determined by local assessors to be the total taxable value of land and additions on the property. | Land | Improvement |
|---|---|---|---|---|
| 2024 | $6,659 | $67,640 | $12,120 | $55,520 |
| 2023 | $2,698 | $67,640 | $12,120 | $55,520 |
| 2022 | $2,705 | $67,640 | $12,120 | $55,520 |
| 2021 | $2,599 | $51,890 | $9,320 | $42,570 |
| 2020 | $2,433 | $51,890 | $9,320 | $42,570 |
| 2019 | $2,450 | $51,890 | $9,320 | $42,570 |
| 2018 | $2,096 | $39,950 | $8,550 | $31,400 |
| 2017 | $2,098 | $39,170 | $7,770 | $31,400 |
| 2016 | $2,083 | $39,170 | $7,770 | $31,400 |
| 2015 | $1,941 | $35,650 | $7,770 | $27,880 |
| 2014 | $1,911 | $35,650 | $7,770 | $27,880 |
| 2013 | $1,911 | $35,650 | $7,770 | $27,880 |
Source: Public Records
Map
Nearby Homes
- 3205 Mahaffey Ct
- 3212 Southern Hills Dr
- 3233 Mahaffey Ct
- 3099 Ambarwent Rd
- 3021 Sumner Dr
- 3161 Innisbrook Ct
- 7287 Candlestone Dr
- 7350 Aplin Dr
- 3072 Bocastle Ct
- 3265 O'Heagra Dr
- 6926 Bennell Dr
- 3292 Draycott Ct
- 7619 Kittansett Ln
- 3188 Creighton Place
- 2909 Princeville Dr
- 3124 Creighton Place
- 7640 Kittansett Ln
- 7673 Harbour Town Dr
- 2968 Stone Mountain Dr
- 2961 Stone Mountain Dr
- 7295 Arborlee Dr
- 7307 Arborlee Dr
- 7289 Arborlee Dr
- 7313 Arborlee Dr
- 7296 Havencroft Dr
- 7300 Havencroft Dr
- 7292 Havencroft Dr
- 7283 Arborlee Dr
- 7308 Havencroft Dr
- 7325 Arborlee Dr
- 7300 Arborlee Dr
- 7306 Arborlee Dr
- 7294 Arborlee Dr
- 7312 Arborlee Dr
- 7275 Arborlee Dr
- 7288 Arborlee Dr
- 3354 Havencroft Ct
- 7320 Arborlee Dr
- 7345 Arborlee Dr
- 3360 Havencroft Ct