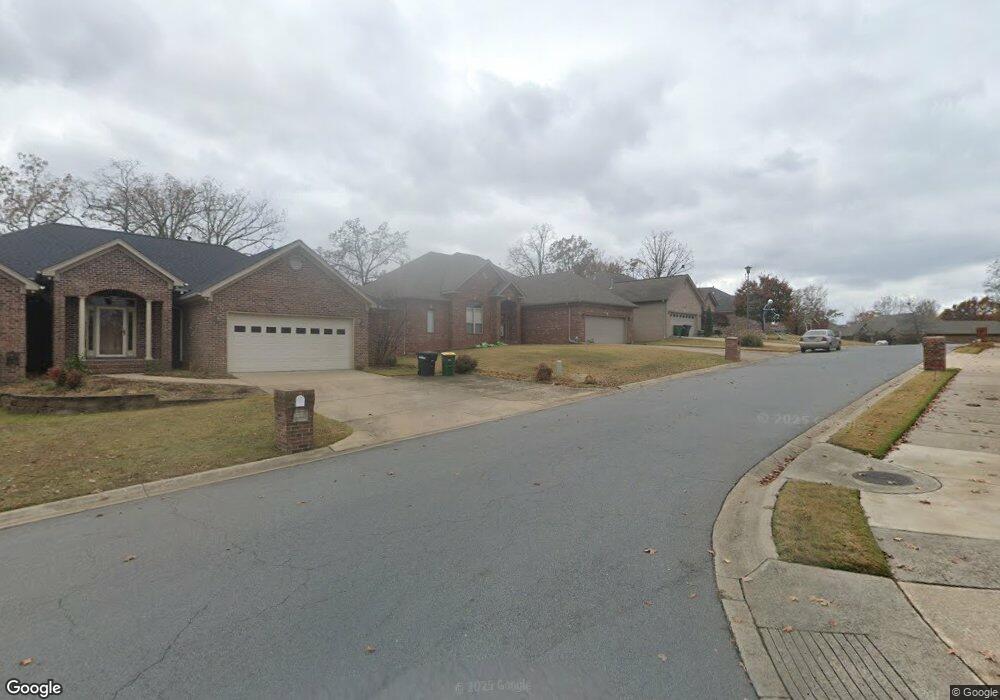
7308 Glenn Hills Dr Sherwood, AR 72120
Estimated Value: $306,000 - $331,000
--
Bed
2
Baths
1,976
Sq Ft
$160/Sq Ft
Est. Value
About This Home
This home is located at 7308 Glenn Hills Dr, Sherwood, AR 72120 and is currently estimated at $315,563, approximately $159 per square foot. 7308 Glenn Hills Dr is a home located in Pulaski County with nearby schools including Clinton Elementary School, Sylvan Hills Middle School, and Sylvan Hills High School.
Ownership History
Date
Name
Owned For
Owner Type
Purchase Details
Closed on
May 3, 2017
Sold by
Tokarz Jamie E and Tokarz Joseph R
Bought by
Atkins Pamela S
Current Estimated Value
Home Financials for this Owner
Home Financials are based on the most recent Mortgage that was taken out on this home.
Original Mortgage
$100,000
Outstanding Balance
$82,802
Interest Rate
4.03%
Estimated Equity
$232,761
Purchase Details
Closed on
Nov 17, 2006
Sold by
Mccord Blake A and Mccord Virginia L
Bought by
Tokarz Joseph R and Tokarz Jamie E
Home Financials for this Owner
Home Financials are based on the most recent Mortgage that was taken out on this home.
Original Mortgage
$41,780
Interest Rate
6.37%
Mortgage Type
Stand Alone Second
Purchase Details
Closed on
Mar 27, 2006
Sold by
Metropolitan Realty & Development Llc
Bought by
Mccord Blake A and Mccord Virginia L
Create a Home Valuation Report for This Property
The Home Valuation Report is an in-depth analysis detailing your home's value as well as a comparison with similar homes in the area
Home Values in the Area
Average Home Value in this Area
Purchase History
| Date | Buyer | Sale Price | Title Company |
|---|---|---|---|
| Atkins Pamela S | -- | -- | |
| Tokarz Joseph R | $209,000 | Professional Land Title Comp | |
| Mccord Blake A | $34,000 | None Available |
Source: Public Records
Mortgage History
| Date | Status | Borrower | Loan Amount |
|---|---|---|---|
| Open | Atkins Pamela S | $100,000 | |
| Closed | Atkins Pamela S | -- | |
| Previous Owner | Tokarz Joseph R | $41,780 |
Source: Public Records
Tax History Compared to Growth
Tax History
| Year | Tax Paid | Tax Assessment Tax Assessment Total Assessment is a certain percentage of the fair market value that is determined by local assessors to be the total taxable value of land and additions on the property. | Land | Improvement |
|---|---|---|---|---|
| 2025 | $2,224 | $50,771 | $9,400 | $41,371 |
| 2024 | $2,224 | $50,771 | $9,400 | $41,371 |
| 2023 | $2,224 | $50,771 | $9,400 | $41,371 |
| 2022 | $2,469 | $50,771 | $9,400 | $41,371 |
| 2021 | $2,301 | $40,660 | $8,480 | $32,180 |
| 2020 | $1,917 | $40,660 | $8,480 | $32,180 |
| 2019 | $1,917 | $40,660 | $8,480 | $32,180 |
| 2018 | $1,942 | $40,660 | $8,480 | $32,180 |
| 2017 | $1,820 | $40,660 | $8,480 | $32,180 |
| 2016 | $1,724 | $36,780 | $8,400 | $28,380 |
| 2015 | $1,868 | $36,780 | $8,400 | $28,380 |
| 2014 | $1,868 | $36,780 | $8,400 | $28,380 |
Source: Public Records
Map
Nearby Homes
- 7416 Glenn Hills Dr
- 2125 Glenn Arbor Ct
- 2125 Gap Creek Dr
- 6813 Gap Point Cir
- 68 Shoshoni Dr
- 6901 Gap Point Cir
- 606 Bay View Ct
- 2226 Bearskin Dr
- 7001 Park Meadows Dr
- 7000 Park Meadows Dr
- 106 Winona Dr
- 201 Bearskin Dr
- 7112 E Ridge Dr
- 2216 Sage Meadows Cir
- 1306 Tupelo Ct
- 112 Sugar Maple Dr
- 1013 Black Bass Cove
- 7204 Northlake Dr
- 11 Whalen Place
- 109 Bucky Beaver St
- 7316 Glenn Hills Dr
- 7300 Glenn Hills Dr
- 2301 Gap Creek Dr
- 2217 Gap Creek Dr
- 7324 Glenn Hills Dr
- 2309 Gap Creek Dr
- 7317 Glenn Hills Dr
- 7309 Glenn Hills Dr
- 2209 Gap Creek Dr
- 2317 Gap Creek Dr
- 1700 Kasey Ct
- 7400 Glenn Hills Dr
- 7208 Glenn Hills Dr
- 7325 Glenn Hills Dr
- 2325 Gap Creek Dr
- 2325 Gap Creek Dr
- 2324 Gap Creek Dr
- 7200 Glenn Hills Dr
- 2316 Gap Creek
- 1708 Kasey Ct