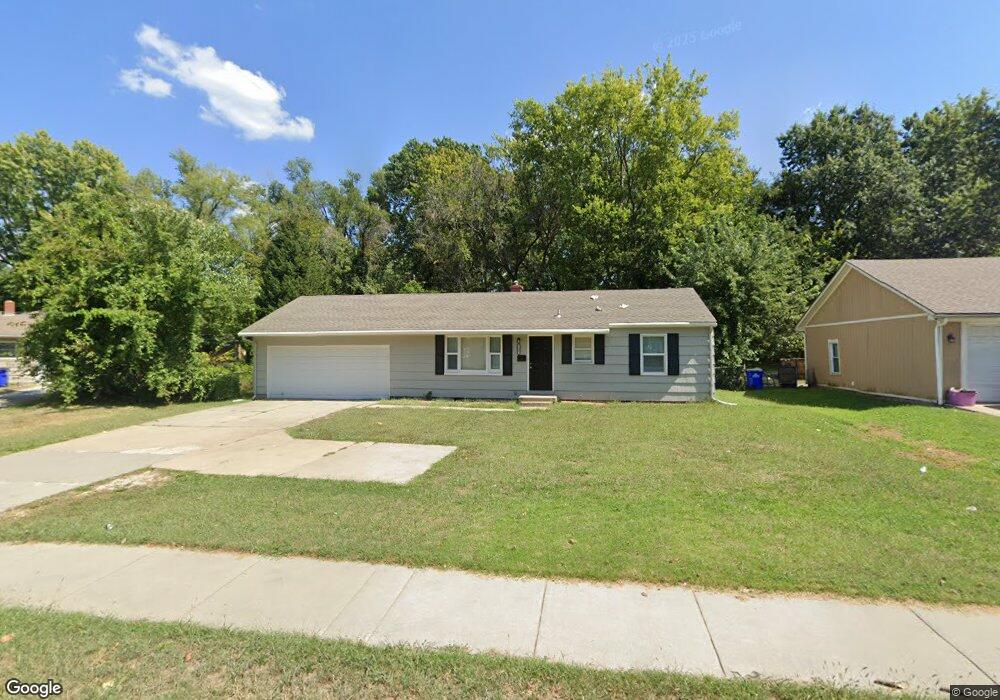
7309 Blue Ridge Blvd Raytown, MO 64133
Estimated Value: $151,000 - $225,000
3
Beds
1
Bath
888
Sq Ft
$204/Sq Ft
Est. Value
About This Home
This home is located at 7309 Blue Ridge Blvd, Raytown, MO 64133 and is currently estimated at $180,917, approximately $203 per square foot. 7309 Blue Ridge Blvd is a home located in Jackson County with nearby schools including Westridge Elementary School, South Middle School, and Carver Christian Academy.
Ownership History
Date
Name
Owned For
Owner Type
Purchase Details
Closed on
Nov 15, 2022
Sold by
Sbd Property Acquisitions Llc
Bought by
Three Kind Llc
Current Estimated Value
Home Financials for this Owner
Home Financials are based on the most recent Mortgage that was taken out on this home.
Original Mortgage
$104,000
Outstanding Balance
$100,775
Interest Rate
6.95%
Mortgage Type
New Conventional
Estimated Equity
$80,142
Purchase Details
Closed on
Dec 18, 2002
Sold by
Harvey David C
Bought by
Gearke Robert
Purchase Details
Closed on
Sep 27, 1995
Sold by
Hetzel Doyle C and Hetzel Lucille D
Bought by
Harvey David C
Home Financials for this Owner
Home Financials are based on the most recent Mortgage that was taken out on this home.
Original Mortgage
$48,400
Interest Rate
7.88%
Mortgage Type
FHA
Create a Home Valuation Report for This Property
The Home Valuation Report is an in-depth analysis detailing your home's value as well as a comparison with similar homes in the area
Home Values in the Area
Average Home Value in this Area
Purchase History
| Date | Buyer | Sale Price | Title Company |
|---|---|---|---|
| Three Kind Llc | -- | Stewart Title Company | |
| Gearke Robert | -- | Ati Title Company | |
| Harvey David C | -- | Old Republic Title Company |
Source: Public Records
Mortgage History
| Date | Status | Borrower | Loan Amount |
|---|---|---|---|
| Open | Three Kind Llc | $104,000 | |
| Previous Owner | Harvey David C | $48,400 |
Source: Public Records
Tax History Compared to Growth
Tax History
| Year | Tax Paid | Tax Assessment Tax Assessment Total Assessment is a certain percentage of the fair market value that is determined by local assessors to be the total taxable value of land and additions on the property. | Land | Improvement |
|---|---|---|---|---|
| 2025 | $3,923 | $15,578 | $5,926 | $9,652 |
| 2024 | $3,896 | $43,482 | $5,983 | $37,499 |
| 2023 | $3,896 | $43,481 | $3,701 | $39,780 |
| 2022 | $1,108 | $11,780 | $3,770 | $8,010 |
| 2021 | $1,112 | $11,780 | $3,770 | $8,010 |
| 2020 | $1,249 | $13,110 | $3,770 | $9,340 |
| 2019 | $1,243 | $13,110 | $3,770 | $9,340 |
| 2018 | $1,141 | $12,465 | $3,281 | $9,184 |
| 2017 | $1,106 | $12,465 | $3,281 | $9,184 |
| 2016 | $1,106 | $12,153 | $2,544 | $9,609 |
| 2014 | $1,086 | $11,799 | $2,470 | $9,329 |
Source: Public Records
Map
Nearby Homes
- 8716 E 74th St
- 8812 E 72nd Terrace
- 8805 E 75th St
- 9111 Vaughn Ave
- 9010 E 75th St
- 8620 Countryshire Ln
- 7036 Hunter St
- 7012 Kentucky Ave
- 7306 Elm Ave
- 6924 Hunter St
- 7628 Booth Ave
- 7632 Booth Ave
- 7705 Wallace Ave
- 7504 Maple Ln
- 8016 E 75th St
- 6824 Laurel Ave
- 7138 Sycamore Ave
- 7701 Elm Ave
- 6710 Lane Ave
- 7901 Tennessee Ave
- 8801 E 73rd St
- 7311 Blue Ridge Blvd
- 8822 Richards Dr
- 8803 E 73rd St
- 8820 Richards Dr
- 7315 Blue Ridge Blvd
- 8805 E 73rd St
- 8824 Richards Dr
- 7248 Blue Ridge Blvd
- 8824 Richards Cir
- 7317 Blue Ridge Blvd
- 8818 Richards Dr
- 8807 E 73rd St
- 7219 Blue Ridge Blvd
- 7319 Blue Ridge Blvd
- 8826 Richards Dr
- 8802 E 73rd St
- 8816 Richards Dr
- 7310 Blue Ridge Blvd
- 8732 E 73rd Terrace