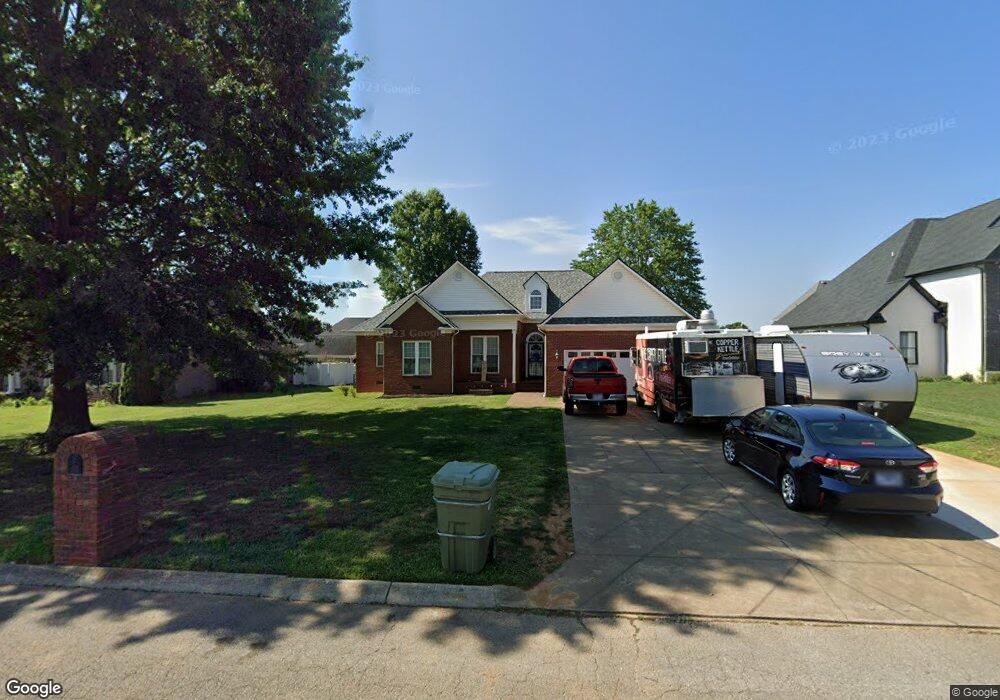
732 Toben Terrace Lawrenceburg, TN 38464
Estimated Value: $340,110 - $435,000
3
Beds
2
Baths
1,856
Sq Ft
$215/Sq Ft
Est. Value
About This Home
This home is located at 732 Toben Terrace, Lawrenceburg, TN 38464 and is currently estimated at $399,528, approximately $215 per square foot. 732 Toben Terrace is a home located in Lawrence County with nearby schools including Ingram Sowell Elementary School, Lawrenceburg Public Elementary School, and David Crockett Elementary School.
Ownership History
Date
Name
Owned For
Owner Type
Purchase Details
Closed on
Sep 13, 2016
Sold by
Stewart Carolyn Marie
Bought by
Arrowood Wayne C and Arrowood Pamela A
Current Estimated Value
Home Financials for this Owner
Home Financials are based on the most recent Mortgage that was taken out on this home.
Original Mortgage
$117,798
Outstanding Balance
$53,785
Interest Rate
3.43%
Mortgage Type
New Conventional
Estimated Equity
$345,743
Purchase Details
Closed on
Jan 22, 2003
Sold by
Coleman Michael W and Coleman Chr
Bought by
Marie Mckissack Carol
Purchase Details
Closed on
Mar 11, 1999
Sold by
Mae Ledbetter Lura
Bought by
Coleman Michael W
Purchase Details
Closed on
Jul 24, 1998
Sold by
Antonio Santini
Bought by
Mae Ledbetter Lura
Purchase Details
Closed on
Jan 9, 1990
Bought by
Ssantini Antonio and Ssantini Lucille
Create a Home Valuation Report for This Property
The Home Valuation Report is an in-depth analysis detailing your home's value as well as a comparison with similar homes in the area
Home Values in the Area
Average Home Value in this Area
Purchase History
| Date | Buyer | Sale Price | Title Company |
|---|---|---|---|
| Arrowood Wayne C | $173,880 | -- | |
| Marie Mckissack Carol | $142,500 | -- | |
| Coleman Michael W | $139,500 | -- | |
| Mae Ledbetter Lura | $139,500 | -- | |
| Ssantini Antonio | -- | -- |
Source: Public Records
Mortgage History
| Date | Status | Borrower | Loan Amount |
|---|---|---|---|
| Open | Arrowood Wayne C | $117,798 |
Source: Public Records
Tax History Compared to Growth
Tax History
| Year | Tax Paid | Tax Assessment Tax Assessment Total Assessment is a certain percentage of the fair market value that is determined by local assessors to be the total taxable value of land and additions on the property. | Land | Improvement |
|---|---|---|---|---|
| 2025 | $2,192 | $70,525 | $0 | $0 |
| 2024 | $2,192 | $70,525 | $8,750 | $61,775 |
| 2023 | $2,192 | $70,525 | $8,750 | $61,775 |
| 2022 | $2,192 | $70,525 | $8,750 | $61,775 |
| 2021 | $1,885 | $42,900 | $8,750 | $34,150 |
| 2020 | $1,885 | $42,900 | $8,750 | $34,150 |
| 2019 | $1,885 | $42,900 | $8,750 | $34,150 |
| 2018 | $1,885 | $42,900 | $8,750 | $34,150 |
| 2017 | $1,885 | $42,900 | $8,750 | $34,150 |
| 2016 | $1,885 | $42,900 | $8,750 | $34,150 |
| 2015 | $1,786 | $42,900 | $8,750 | $34,150 |
| 2014 | $1,635 | $39,275 | $7,500 | $31,775 |
Source: Public Records
Map
Nearby Homes
- 724 Toben Terrace
- 734 Toben Terrace
- 720 Toben Terrace
- 738 Toben Terrace
- 733 Toben Terrace
- 735 Toben Terrace
- 731 Toben Terrace
- 727 Toben Terrace
- 725 Toben Terrace
- 739 Toben Terrace
- 723 Toben Terrace
- 723 Toben Terrace
- 699 Parkes Cir
- 719 Toben Terrace
- 697 Parkes Cir
- 701 Parkes Cir
- 1509 Springer Rd
- 1509 Springer Rd
- 435 Weakley Creek Rd
- 1505 Springer Rd