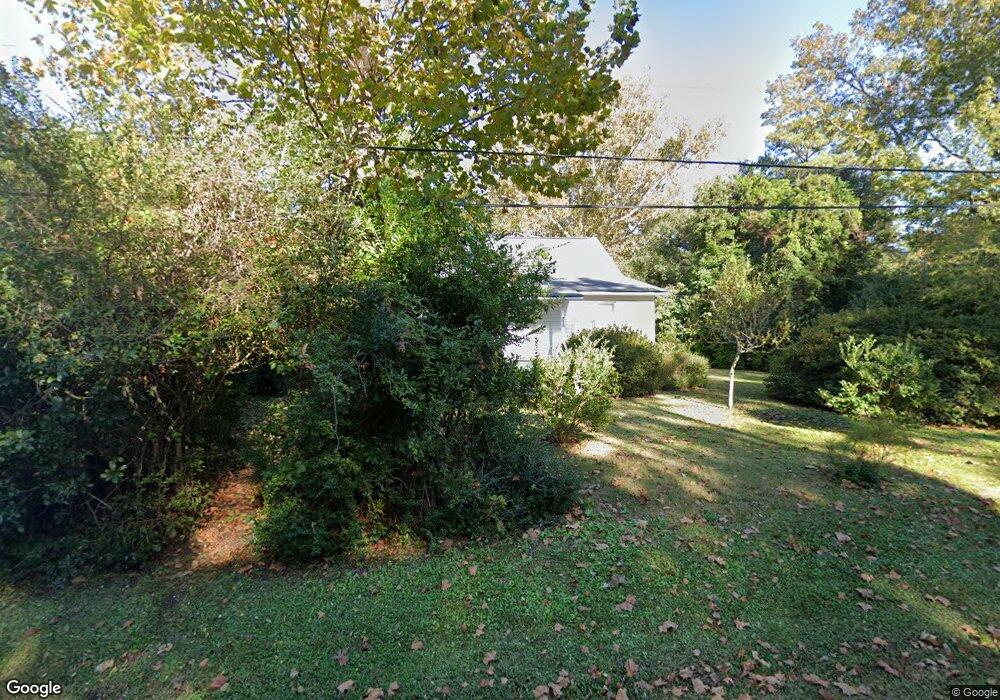
7320 Anaca Point Rd Wilmington, NC 28411
Estimated Value: $372,000 - $490,000
3
Beds
2
Baths
1,390
Sq Ft
$312/Sq Ft
Est. Value
About This Home
This home is located at 7320 Anaca Point Rd, Wilmington, NC 28411 and is currently estimated at $433,108, approximately $311 per square foot. 7320 Anaca Point Rd is a home located in New Hanover County with nearby schools including Ogden Elementary School, M.C.S. Noble Middle School, and Emsley A. Laney High School.
Ownership History
Date
Name
Owned For
Owner Type
Purchase Details
Closed on
Jul 25, 2025
Sold by
Holland Ely Sharon Marie and Ross Ely Robert
Bought by
Ely Sharon Holland and Ely Robert Ross
Current Estimated Value
Purchase Details
Closed on
Jul 23, 2004
Sold by
Ndp Llc
Bought by
Ely Robert Ross Sharon Marie H
Purchase Details
Closed on
Jan 17, 2003
Sold by
Ndp Llc
Bought by
Ely Robert Ross Sharon Marie H
Purchase Details
Closed on
Jan 10, 2003
Sold by
Ndp Llc
Bought by
Ely Robert Ross Sharon Marie H
Purchase Details
Closed on
Aug 13, 2002
Sold by
Paliouras Helen C James N
Bought by
Ndp Llc
Purchase Details
Closed on
Jun 9, 1978
Sold by
Costakis Helen Compos Exec
Bought by
Ely Robert R Sharon M
Create a Home Valuation Report for This Property
The Home Valuation Report is an in-depth analysis detailing your home's value as well as a comparison with similar homes in the area
Home Values in the Area
Average Home Value in this Area
Purchase History
| Date | Buyer | Sale Price | Title Company |
|---|---|---|---|
| Ely Sharon Holland | -- | None Listed On Document | |
| Ely Robert Ross | -- | None Listed On Document | |
| Ely Robert Ross Sharon Marie H | -- | -- | |
| Ely Robert Ross Sharon Marie H | $12,500 | -- | |
| Ely Robert Ross Sharon Marie H | $12,500 | -- | |
| Ndp Llc | -- | -- | |
| Ely Robert R Sharon M | -- | -- |
Source: Public Records
Mortgage History
| Date | Status | Borrower | Loan Amount |
|---|---|---|---|
| Previous Owner | Ely Robert Ross | $295,500 | |
| Previous Owner | Ely Robert Ross | $60,000 | |
| Previous Owner | Ely Robert Ross | $70,000 |
Source: Public Records
Tax History Compared to Growth
Tax History
| Year | Tax Paid | Tax Assessment Tax Assessment Total Assessment is a certain percentage of the fair market value that is determined by local assessors to be the total taxable value of land and additions on the property. | Land | Improvement |
|---|---|---|---|---|
| 2025 | -- | $411,100 | $251,100 | $160,000 |
| 2024 | -- | $268,900 | $210,800 | $58,100 |
| 2023 | -- | $268,900 | $210,800 | $58,100 |
| 2022 | $0 | $268,900 | $210,800 | $58,100 |
| 2021 | $649 | $268,900 | $210,800 | $58,100 |
| 2020 | $649 | $195,000 | $127,400 | $67,600 |
| 2019 | $649 | $195,000 | $127,400 | $67,600 |
| 2018 | $0 | $195,000 | $127,400 | $67,600 |
| 2017 | -- | $195,000 | $127,400 | $67,600 |
| 2016 | $1,139 | $164,300 | $120,000 | $44,300 |
| 2015 | $1,058 | $164,300 | $120,000 | $44,300 |
| 2014 | $1,040 | $164,300 | $120,000 | $44,300 |
Source: Public Records
Map
Nearby Homes
- 1109 Middle Sound Loop Rd
- 7261 Winding Marsh Ct
- 7237 Winding Marsh Ct
- 7229 Winding Marsh Dr
- 7245 Winding Marsh Ct
- 437 Biscayne Dr
- 125 Northhills Dr
- 644 Bayshore Dr
- 243 Pages Creek Dr
- 1501 Field View Rd
- 802 Anchors Bend Way
- 802 Anchors Bend Way Unit Lot 15
- 804 Anchors Bend Way Unit Lot 14
- 804 Anchors Bend Way
- 806 Anchors Bend Way Unit , 13
- 808 Anchors Bend Way Unit , 12
- 7003 Northbend Rd
- 609 Bayshore Dr
- 818 Anchors Bend Way Unit Lot 10
- 821 Anchors Bend Way Unit , 17
- 7310 Anaca Point Rd
- 7332 Anaca Point Rd
- 7233 Anaca Point Rd
- 7229 Anaca Point Rd
- 1210 Hellene Dr
- 7300 Anaca Point Rd
- 7305 Anaca Point Rd
- 1202 Hellene Dr
- 1218 Hellene Dr
- 1207 Hellene Dr
- 1215 Hellene Dr
- 1211 Hellene Dr
- 1214 Hellene Dr
- 1206 Hellene Dr
- 7329 Anaca Point Rd
- 1222 Hellene Dr
- 7331 Anaca Point Rd
- 7225 Anaca Point Rd
- 7228 Anaca Point Rd
- 1226 Hellene Dr