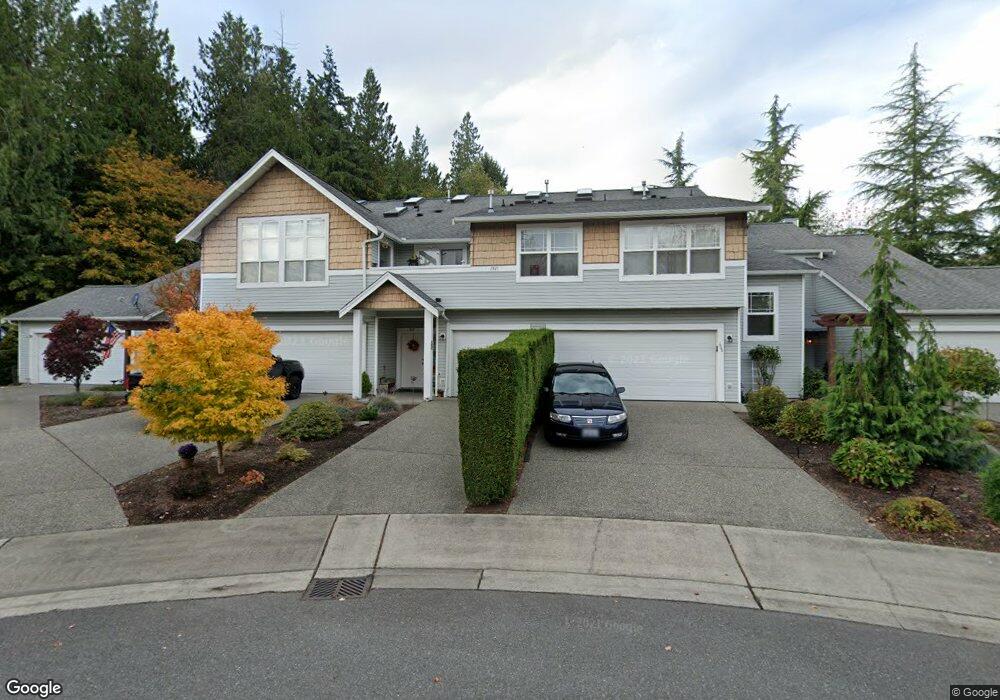
7321 Centerville Ct Unit 605 Stanwood, WA 98292
Estimated Value: $446,000 - $491,000
2
Beds
2
Baths
1,331
Sq Ft
$351/Sq Ft
Est. Value
About This Home
This home is located at 7321 Centerville Ct Unit 605, Stanwood, WA 98292 and is currently estimated at $467,796, approximately $351 per square foot. 7321 Centerville Ct Unit 605 is a home located in Snohomish County with nearby schools including Twin City Elementary School, Port Susan Middle School, and Stanwood High School.
Ownership History
Date
Name
Owned For
Owner Type
Purchase Details
Closed on
Oct 28, 2016
Sold by
Brasch Donald A and Brasch Gloria M
Bought by
Linn Joyce L and Allen Linn Family Trust
Current Estimated Value
Purchase Details
Closed on
Sep 13, 2016
Sold by
Brasch Eric Murray and Brasch Robert Mark
Bought by
Brasch Donald A and Brasch Gloria M
Purchase Details
Closed on
Aug 22, 2006
Sold by
Brasch Donald A and Brasch Gloria M
Bought by
Brasch Eric Murray and Brasch Robert Mark
Purchase Details
Closed on
Aug 14, 2001
Sold by
Stanwood Condominiums Llc
Bought by
Brasch Donald A and Brasch Gloria M
Home Financials for this Owner
Home Financials are based on the most recent Mortgage that was taken out on this home.
Original Mortgage
$135,600
Interest Rate
6.75%
Create a Home Valuation Report for This Property
The Home Valuation Report is an in-depth analysis detailing your home's value as well as a comparison with similar homes in the area
Home Values in the Area
Average Home Value in this Area
Purchase History
| Date | Buyer | Sale Price | Title Company |
|---|---|---|---|
| Linn Joyce L | $256,000 | Chicago Title Company Of Wa | |
| Brasch Donald A | -- | None Available | |
| Brasch Eric Murray | $28,089 | Pnwt | |
| Brasch Donald A | $169,500 | Island Title Company |
Source: Public Records
Mortgage History
| Date | Status | Borrower | Loan Amount |
|---|---|---|---|
| Previous Owner | Brasch Donald A | $135,600 |
Source: Public Records
Tax History Compared to Growth
Tax History
| Year | Tax Paid | Tax Assessment Tax Assessment Total Assessment is a certain percentage of the fair market value that is determined by local assessors to be the total taxable value of land and additions on the property. | Land | Improvement |
|---|---|---|---|---|
| 2025 | $3,789 | $454,000 | $24,500 | $429,500 |
| 2024 | $3,789 | $445,000 | $24,000 | $421,000 |
| 2023 | $3,048 | $377,000 | $27,500 | $349,500 |
| 2022 | $3,116 | $314,000 | $23,500 | $290,500 |
| 2020 | $2,918 | $270,000 | $23,500 | $246,500 |
| 2019 | $2,606 | $245,000 | $24,000 | $221,000 |
| 2018 | $2,730 | $244,000 | $24,000 | $220,000 |
| 2017 | $2,363 | $220,000 | $22,000 | $198,000 |
| 2016 | $2,395 | $219,000 | $19,500 | $199,500 |
| 2015 | $2,055 | $190,000 | $19,500 | $170,500 |
| 2013 | $1,979 | $171,000 | $19,500 | $151,500 |
Source: Public Records
Map
Nearby Homes
- 7319 Centerville Ct Unit 703
- 7318 Centerville Ct Unit 301
- 26127 74th Ave NW
- 7104 265th St NW Unit 415
- 7805 260th St NW
- 7836 263rd Place NW
- 7912 263rd Place NW
- 26480 72nd Ave NW
- 7907 Port Susan Place Unit 6
- 26327 64th Ave NW
- 27237 Church Creek Loop NW
- 7671 275th St NW
- 27714 74th Ave NW
- 8200 Hennings Dr
- 27802 73rd Dr NW
- 7725 278th Place NW
- The Lewis Plan at Summerset Springs
- The Bennett Plan at Summerset Springs
- The Aubrey Plan at Summerset Springs
- The Amber Plan at Summerset Springs
- 7318 Centerville Ct
- 7323 Centerville Ct Unit 805
- 7323 Centerville Ct Unit 804
- 7323 Centerville Ct Unit 802
- 7323 Centerville Ct Unit 801
- 7319 Centerville Ct Unit 705
- 7319 Centerville Ct Unit 704
- 7319 Centerville Ct Unit 702
- 7319 Centerville Ct Unit 701
- 7321 Centerville Ct Unit 604
- 7321 Centerville Ct Unit 603
- 7321 Centerville Ct Unit 602
- 7321 Centerville Ct Unit 601
- 7428 Centerville Ct Unit 505
- 7428 Centerville Ct Unit 501
- 7323 Centerville Ct Unit 803
- 7428 Centerville Ct Unit 504
- 7428 Centerville Ct Unit 503
- 7428 Centerville Ct Unit 502
- 7318 Centerville Ct Unit 305