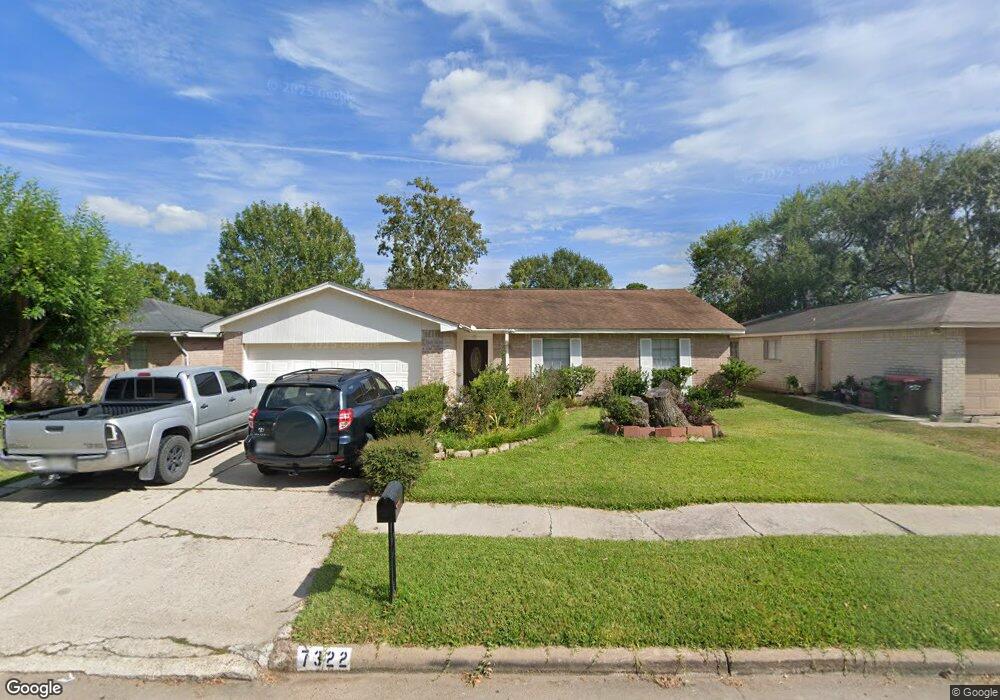
7322 Breccia Dr Houston, TX 77041
Hearthstone NeighborhoodEstimated Value: $225,607 - $244,000
4
Beds
2
Baths
1,568
Sq Ft
$152/Sq Ft
Est. Value
About This Home
This home is located at 7322 Breccia Dr, Houston, TX 77041 and is currently estimated at $237,652, approximately $151 per square foot. 7322 Breccia Dr is a home located in Harris County with nearby schools including Hairgrove Elementary School, Labay Middle School, and Cypress Falls High School.
Ownership History
Date
Name
Owned For
Owner Type
Purchase Details
Closed on
Apr 30, 2019
Sold by
Martinez Denya O
Bought by
Maldonado Ann
Current Estimated Value
Purchase Details
Closed on
Jun 28, 2000
Sold by
Nguyen Mai Thi and Nguyen Warren Christy Maithi
Bought by
Martinez Denys O and Maldonado Ana
Home Financials for this Owner
Home Financials are based on the most recent Mortgage that was taken out on this home.
Original Mortgage
$78,859
Interest Rate
8.66%
Mortgage Type
FHA
Purchase Details
Closed on
May 13, 2000
Sold by
Nguyen Warren Christy Maithi and Nguyen Michael Loi
Bought by
Nguyen Warren Christy Maithi
Home Financials for this Owner
Home Financials are based on the most recent Mortgage that was taken out on this home.
Original Mortgage
$78,859
Interest Rate
8.66%
Mortgage Type
FHA
Create a Home Valuation Report for This Property
The Home Valuation Report is an in-depth analysis detailing your home's value as well as a comparison with similar homes in the area
Home Values in the Area
Average Home Value in this Area
Purchase History
| Date | Buyer | Sale Price | Title Company |
|---|---|---|---|
| Maldonado Ann | -- | None Available | |
| Martinez Denys O | -- | Fidelity National Title | |
| Nguyen Warren Christy Maithi | -- | Fidelity National Title |
Source: Public Records
Mortgage History
| Date | Status | Borrower | Loan Amount |
|---|---|---|---|
| Previous Owner | Martinez Denys O | $78,859 |
Source: Public Records
Tax History Compared to Growth
Tax History
| Year | Tax Paid | Tax Assessment Tax Assessment Total Assessment is a certain percentage of the fair market value that is determined by local assessors to be the total taxable value of land and additions on the property. | Land | Improvement |
|---|---|---|---|---|
| 2025 | $1,443 | $206,505 | $73,377 | $133,128 |
| 2024 | $1,443 | $220,009 | $73,377 | $146,632 |
| 2023 | $1,443 | $204,930 | $52,731 | $152,199 |
| 2022 | $4,561 | $191,178 | $40,455 | $150,723 |
| 2021 | $4,385 | $159,343 | $40,455 | $118,888 |
| 2020 | $4,147 | $147,250 | $29,295 | $117,955 |
| 2019 | $3,888 | $139,937 | $19,215 | $120,722 |
| 2018 | $630 | $117,204 | $19,215 | $97,989 |
| 2017 | $3,547 | $117,204 | $19,215 | $97,989 |
| 2016 | $3,316 | $109,575 | $16,065 | $93,510 |
| 2015 | $2,337 | $101,957 | $16,065 | $85,892 |
| 2014 | $2,337 | $95,598 | $10,080 | $85,518 |
Source: Public Records
Map
Nearby Homes
- 7315 Weatherhill Ln
- 13323 Firebrick Dr
- 13322 Chaston Dr
- 13202 Chasworth Dr
- 13122 Eldridge Chase
- 7402 Burkridge Dr
- 7511 Weatherhill Ln
- 7315 Millbrae Ln
- 13219 Vista Brook Dr
- 7530 Lemma Dr
- 13215 Vista Oro Dr
- 7635 Log Cradle Dr
- 7607 Wovenwood Ln
- 7310 Blenheim Palace Ln
- 7618 Mauna Kai Dr
- 7823 Autumn Hollow Ln
- 14311 Islandwoods Dr
- 7315 Muirfield Valley Dr
- 14410 Muirfield Ln
- 13814 Swan Hollow Ln
- 7326 Breccia Dr
- 7318 Breccia Dr
- 7339 Cornwall Bridge Ln
- 7330 Breccia Dr
- 7314 Breccia Dr
- 7343 Cornwall Bridge Ln
- 7335 Cornwall Bridge Ln
- 7323 Breccia Dr
- 7347 Cornwall Bridge Ln
- 7331 Cornwall Bridge Ln
- 7319 Breccia Dr
- 7334 Breccia Dr
- 7327 Breccia Dr
- 7310 Breccia Dr
- 7315 Breccia Dr
- 7351 Cornwall Bridge Ln
- 7327 Cornwall Bridge Ln
- 7331 Breccia Dr
- 7311 Breccia Dr
- 7402 Breccia Dr