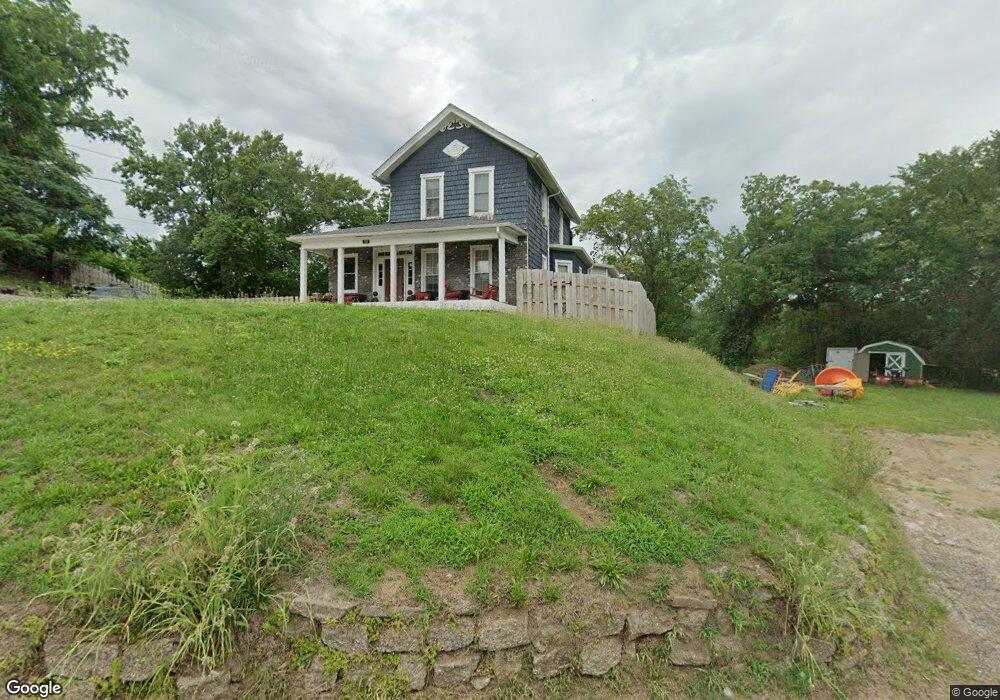
734 E 7th St Davenport, IA 52803
Central Davenport NeighborhoodEstimated Value: $109,000 - $197,743
4
Beds
4
Baths
2,836
Sq Ft
$54/Sq Ft
Est. Value
About This Home
This home is located at 734 E 7th St, Davenport, IA 52803 and is currently estimated at $154,436, approximately $54 per square foot. 734 E 7th St is a home located in Scott County with nearby schools including Walnut Hill Elementary School, McKinley Elementary School, and Casey County Middle School.
Ownership History
Date
Name
Owned For
Owner Type
Purchase Details
Closed on
Mar 12, 2022
Sold by
Chamberlin Mary Ellen
Bought by
Wilmington Issac and Wilmington Shannon Marlene
Current Estimated Value
Purchase Details
Closed on
Sep 27, 2019
Sold by
Wilmington Isaac and Wilmington Shannon M
Bought by
Wilmington Isaac and Wilmington Shannon M
Home Financials for this Owner
Home Financials are based on the most recent Mortgage that was taken out on this home.
Original Mortgage
$108,000
Interest Rate
3.5%
Mortgage Type
New Conventional
Purchase Details
Closed on
Jan 3, 2012
Sold by
Edgeworth Cedric and Edgeworth Deborah
Bought by
Wilmington Isaac and Wiles Shannon
Create a Home Valuation Report for This Property
The Home Valuation Report is an in-depth analysis detailing your home's value as well as a comparison with similar homes in the area
Home Values in the Area
Average Home Value in this Area
Purchase History
| Date | Buyer | Sale Price | Title Company |
|---|---|---|---|
| Wilmington Issac | -- | None Listed On Document | |
| Wilmington Isaac | -- | -- | |
| Wilmington Isaac | $49,000 | None Available |
Source: Public Records
Mortgage History
| Date | Status | Borrower | Loan Amount |
|---|---|---|---|
| Previous Owner | Wilmington Isaac | $108,000 |
Source: Public Records
Tax History Compared to Growth
Tax History
| Year | Tax Paid | Tax Assessment Tax Assessment Total Assessment is a certain percentage of the fair market value that is determined by local assessors to be the total taxable value of land and additions on the property. | Land | Improvement |
|---|---|---|---|---|
| 2025 | $2,496 | $156,850 | $16,560 | $140,290 |
| 2024 | $2,278 | $149,840 | $16,560 | $133,280 |
| 2023 | -- | $141,030 | $16,560 | $124,470 |
| 2022 | $942 | $111,360 | $6,440 | $104,920 |
| 2021 | $942 | $52,900 | $6,440 | $46,460 |
| 2020 | $670 | $39,600 | $6,440 | $33,160 |
| 2019 | $904 | $39,600 | $6,440 | $33,160 |
| 2018 | $678 | $39,600 | $6,440 | $33,160 |
| 2017 | $220 | $39,600 | $6,440 | $33,160 |
| 2016 | $1,434 | $39,490 | $0 | $0 |
| 2015 | $674 | $36,720 | $0 | $0 |
| 2014 | $622 | $36,720 | $0 | $0 |
| 2013 | $802 | $0 | $0 | $0 |
| 2012 | -- | $36,970 | $4,480 | $32,490 |
Source: Public Records
Map
Nearby Homes