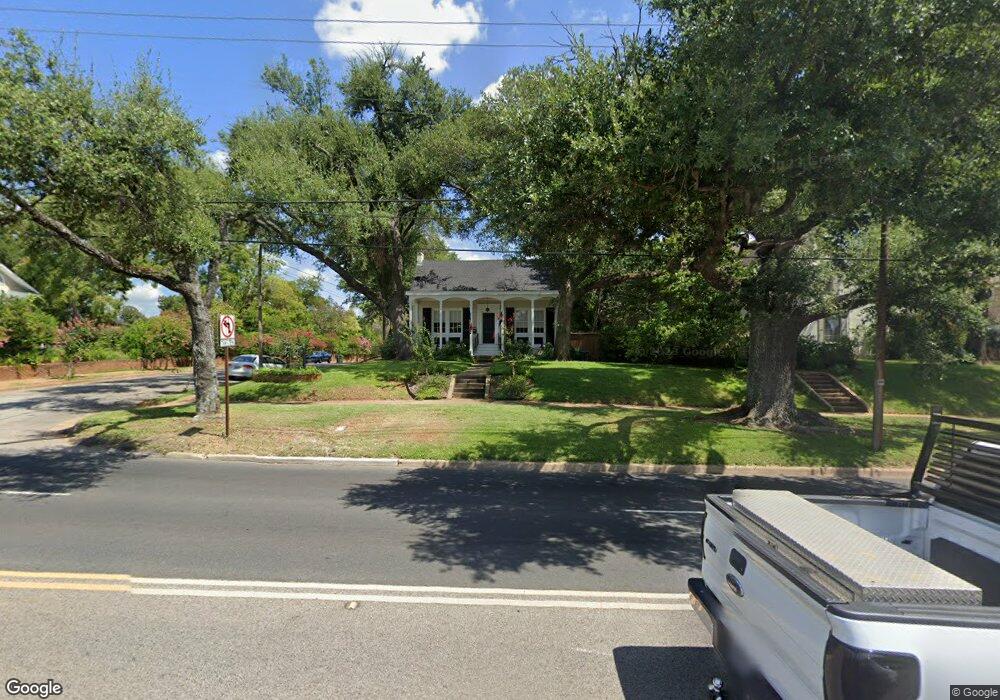
734 S Broadway Ave Tyler, TX 75701
Charnwood District NeighborhoodEstimated Value: $361,000 - $416,000
3
Beds
3
Baths
2,783
Sq Ft
$139/Sq Ft
Est. Value
About This Home
This home is located at 734 S Broadway Ave, Tyler, TX 75701 and is currently estimated at $387,416, approximately $139 per square foot. 734 S Broadway Ave is a home located in Smith County with nearby schools including Bell Elementary School, Hogg Middle School, and Tyler Legacy High School.
Ownership History
Date
Name
Owned For
Owner Type
Purchase Details
Closed on
Sep 10, 2018
Sold by
Wright Marvin E and Wright Sarah B
Bought by
Wright Donna
Current Estimated Value
Purchase Details
Closed on
Dec 28, 2011
Sold by
Hansen John W
Bought by
Wright Marvin E and Wright Sarah B
Home Financials for this Owner
Home Financials are based on the most recent Mortgage that was taken out on this home.
Original Mortgage
$136,800
Outstanding Balance
$93,329
Interest Rate
4.03%
Mortgage Type
New Conventional
Estimated Equity
$294,087
Purchase Details
Closed on
Dec 14, 2007
Sold by
Neyman Charles David and Neyman Krista Marie
Bought by
Hansen John W
Home Financials for this Owner
Home Financials are based on the most recent Mortgage that was taken out on this home.
Original Mortgage
$158,949
Interest Rate
6.27%
Mortgage Type
Purchase Money Mortgage
Create a Home Valuation Report for This Property
The Home Valuation Report is an in-depth analysis detailing your home's value as well as a comparison with similar homes in the area
Home Values in the Area
Average Home Value in this Area
Purchase History
| Date | Buyer | Sale Price | Title Company |
|---|---|---|---|
| Wright Donna | -- | None Available | |
| Wright Marvin E | -- | None Available | |
| Hansen John W | -- | None Available |
Source: Public Records
Mortgage History
| Date | Status | Borrower | Loan Amount |
|---|---|---|---|
| Open | Wright Marvin E | $136,800 | |
| Previous Owner | Hansen John W | $158,949 |
Source: Public Records
Tax History Compared to Growth
Tax History
| Year | Tax Paid | Tax Assessment Tax Assessment Total Assessment is a certain percentage of the fair market value that is determined by local assessors to be the total taxable value of land and additions on the property. | Land | Improvement |
|---|---|---|---|---|
| 2024 | $6,008 | $353,131 | $72,774 | $280,357 |
| 2023 | $6,168 | $353,841 | $72,774 | $281,067 |
| 2022 | $5,640 | $287,880 | $48,516 | $239,364 |
| 2021 | $5,360 | $255,485 | $48,516 | $206,969 |
| 2020 | $4,507 | $210,636 | $31,050 | $179,586 |
| 2019 | $4,449 | $203,480 | $31,050 | $172,430 |
| 2018 | $4,248 | $195,321 | $31,050 | $164,271 |
| 2017 | $4,261 | $199,590 | $31,050 | $168,540 |
| 2016 | $4,108 | $192,431 | $31,050 | $161,381 |
| 2015 | $3,836 | $185,737 | $31,050 | $154,687 |
| 2014 | $3,836 | $180,532 | $31,050 | $149,482 |
Source: Public Records
Map
Nearby Homes
- 124 Rowland Place
- 128 Rowland Place
- 145 Rowland Place
- 735 S Donnybrook Ave
- 201 W Rusk St
- 300 E Dodge St
- 517 E Wells St
- 309 E Dodge St
- 310 W Dobbs St
- 502 S Fannin Ave
- 815 S Chilton Ave
- 841 S Chilton Ave
- 400 Lindsey Ln
- 428 S Bois d Arc Ave
- 520 E Lake St
- 114 E 2nd St
- 1021 S Robertson Ave
- 513 W 1st St
- 705 S Vine Ave
- 818 W Rusk St
- 738 S Broadway Ave
- 738 738 S Broadway
- 107 107 Rowland Place
- 107 Rowland Place
- 806 806 S Broadway
- 806 S Broadway Ave
- 720 S Broadway Ave
- 111 Rowland Place
- 111 Rowland Place
- 111 Rowland Place Unit 3
- 119 Rowland Place
- 121 Rowland Place
- 777 S Broadway Ave
- 814 S Broadway Ave
- 123 Rowland Place
- 805 805 S Broadway
- 714 S Broadway Ave
- 112 Rowland Place
- 125 Rowland Place
- 805 S Broadway Ave