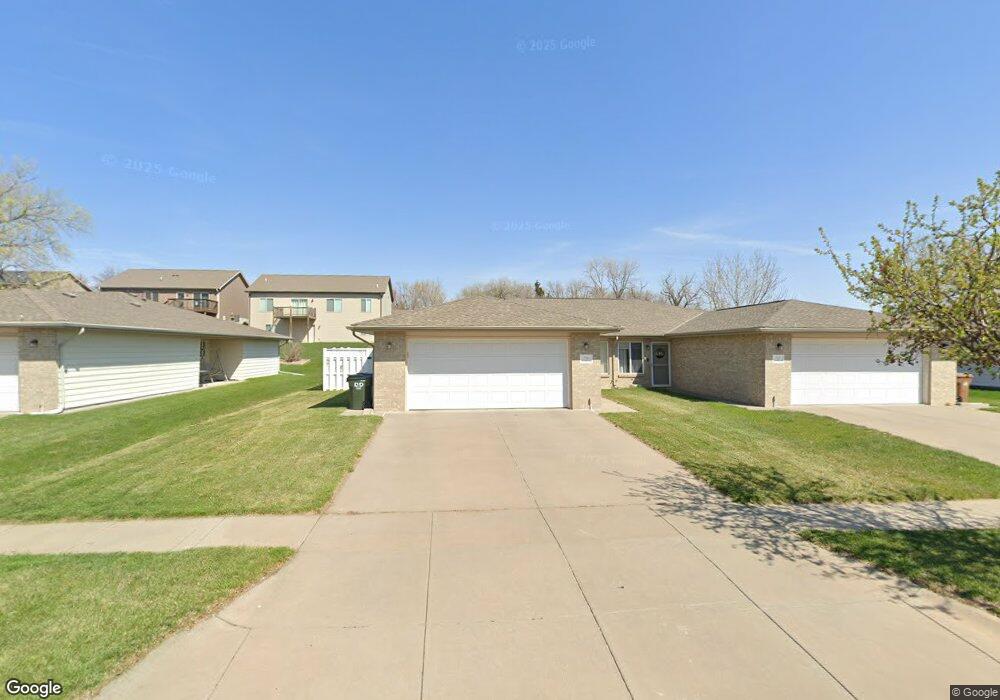
736 Folsom Ln Lincoln, NE 68522
West A NeighborhoodEstimated Value: $191,000 - $202,958
2
Beds
2
Baths
1,100
Sq Ft
$179/Sq Ft
Est. Value
About This Home
This home is located at 736 Folsom Ln, Lincoln, NE 68522 and is currently estimated at $197,240, approximately $179 per square foot. 736 Folsom Ln is a home located in Lancaster County with nearby schools including Lakeview Elementary School, Park Middle School, and Lincoln High School.
Ownership History
Date
Name
Owned For
Owner Type
Purchase Details
Closed on
Mar 6, 2023
Sold by
Burbach Irere L
Bought by
Ramaekers Jessica L
Current Estimated Value
Home Financials for this Owner
Home Financials are based on the most recent Mortgage that was taken out on this home.
Original Mortgage
$157,500
Outstanding Balance
$152,377
Interest Rate
6.13%
Mortgage Type
New Conventional
Estimated Equity
$44,863
Create a Home Valuation Report for This Property
The Home Valuation Report is an in-depth analysis detailing your home's value as well as a comparison with similar homes in the area
Home Values in the Area
Average Home Value in this Area
Purchase History
| Date | Buyer | Sale Price | Title Company |
|---|---|---|---|
| Ramaekers Jessica L | $175,000 | -- |
Source: Public Records
Mortgage History
| Date | Status | Borrower | Loan Amount |
|---|---|---|---|
| Open | Ramaekers Jessica L | $157,500 |
Source: Public Records
Tax History Compared to Growth
Tax History
| Year | Tax Paid | Tax Assessment Tax Assessment Total Assessment is a certain percentage of the fair market value that is determined by local assessors to be the total taxable value of land and additions on the property. | Land | Improvement |
|---|---|---|---|---|
| 2025 | $2,374 | $193,100 | $40,000 | $153,100 |
| 2024 | $2,374 | $171,800 | $35,000 | $136,800 |
| 2023 | $2,879 | $171,800 | $35,000 | $136,800 |
| 2022 | $2,792 | $140,100 | $30,000 | $110,100 |
| 2021 | $2,820 | $140,100 | $25,500 | $114,600 |
| 2020 | $2,362 | $123,500 | $25,500 | $98,000 |
| 2019 | $0 | $123,500 | $25,500 | $98,000 |
| 2018 | $0 | $110,300 | $21,300 | $89,000 |
| 2017 | $0 | $110,300 | $21,300 | $89,000 |
| 2016 | $0 | $104,000 | $17,000 | $87,000 |
| 2015 | -- | $104,000 | $17,000 | $87,000 |
| 2014 | -- | $103,700 | $17,000 | $86,700 |
| 2013 | -- | $103,700 | $17,000 | $86,700 |
Source: Public Records
Map
Nearby Homes