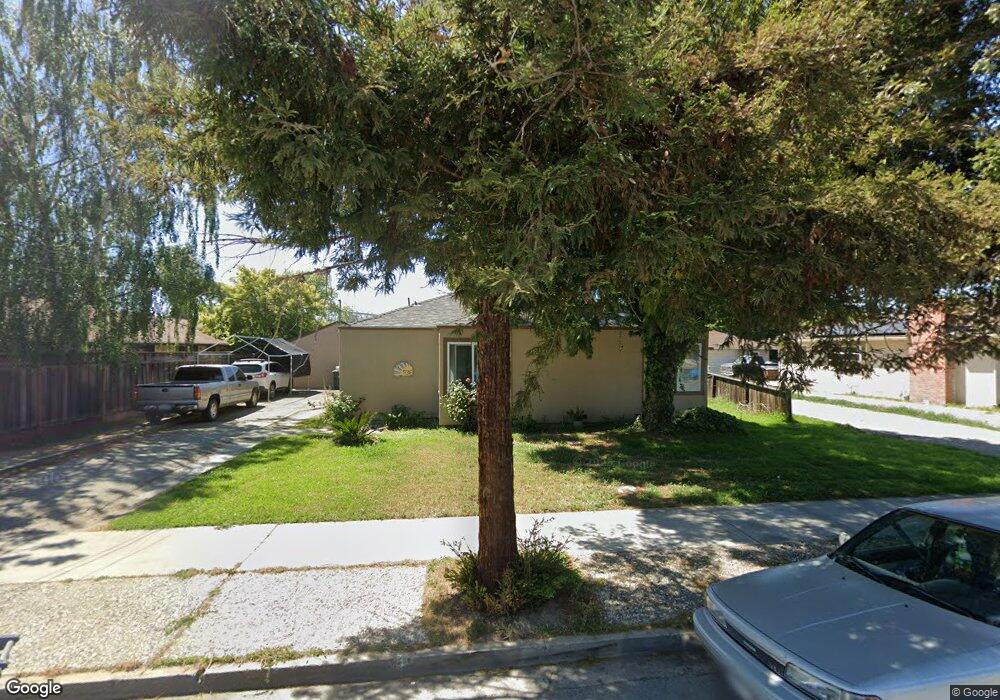
736 Line St Hollister, CA 95023
Estimated Value: $651,382 - $701,000
--
Bed
--
Bath
--
Sq Ft
8,407
Sq Ft Lot
About This Home
This home is located at 736 Line St, Hollister, CA 95023 and is currently estimated at $673,846. 736 Line St is a home located in San Benito County with nearby schools including R. O. Hardin Elementary School, Rancho San Justo School, and San Benito High School.
Ownership History
Date
Name
Owned For
Owner Type
Purchase Details
Closed on
Mar 6, 2003
Sold by
Moreno Mejia Joaquin
Bought by
Guzman Alma
Current Estimated Value
Home Financials for this Owner
Home Financials are based on the most recent Mortgage that was taken out on this home.
Original Mortgage
$273,000
Outstanding Balance
$116,934
Interest Rate
5.83%
Estimated Equity
$556,912
Purchase Details
Closed on
Jan 11, 2002
Sold by
Vandyke Scott and Vandyke Lydia
Bought by
Moreno Mejia Joaquin and Guzman Alma
Home Financials for this Owner
Home Financials are based on the most recent Mortgage that was taken out on this home.
Original Mortgage
$216,000
Interest Rate
7.87%
Create a Home Valuation Report for This Property
The Home Valuation Report is an in-depth analysis detailing your home's value as well as a comparison with similar homes in the area
Home Values in the Area
Average Home Value in this Area
Purchase History
| Date | Buyer | Sale Price | Title Company |
|---|---|---|---|
| Guzman Alma | -- | Santa Cruz Title Company | |
| Moreno Mejia Joaquin | $270,000 | Fidelity National Title Co |
Source: Public Records
Mortgage History
| Date | Status | Borrower | Loan Amount |
|---|---|---|---|
| Open | Guzman Alma | $273,000 | |
| Closed | Moreno Mejia Joaquin | $216,000 | |
| Closed | Moreno Mejia Joaquin | $54,000 |
Source: Public Records
Tax History Compared to Growth
Tax History
| Year | Tax Paid | Tax Assessment Tax Assessment Total Assessment is a certain percentage of the fair market value that is determined by local assessors to be the total taxable value of land and additions on the property. | Land | Improvement |
|---|---|---|---|---|
| 2025 | $4,976 | $403,863 | $221,591 | $182,272 |
| 2023 | $4,976 | $388,184 | $212,988 | $175,196 |
| 2022 | $4,796 | $380,573 | $208,812 | $171,761 |
| 2021 | $4,728 | $373,112 | $204,718 | $168,394 |
| 2020 | $4,745 | $369,287 | $202,619 | $166,668 |
| 2019 | $4,608 | $362,047 | $198,647 | $163,400 |
| 2018 | $4,513 | $354,949 | $194,752 | $160,197 |
| 2017 | $4,450 | $347,990 | $190,934 | $157,056 |
| 2016 | $4,191 | $341,168 | $187,191 | $153,977 |
| 2015 | $4,149 | $336,045 | $184,380 | $151,665 |
| 2014 | $3,719 | $315,000 | $166,977 | $148,023 |
Source: Public Records
Map
Nearby Homes