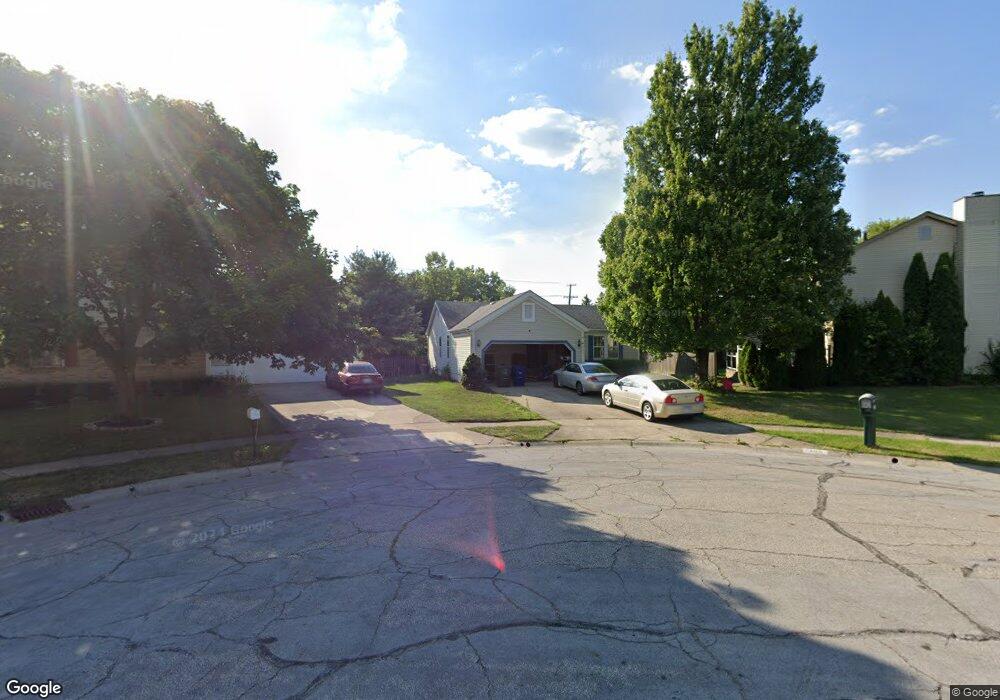
7380 Southern Hills Ct Pickerington, OH 43147
Estimated Value: $305,883 - $333,000
3
Beds
2
Baths
1,428
Sq Ft
$222/Sq Ft
Est. Value
About This Home
This home is located at 7380 Southern Hills Ct, Pickerington, OH 43147 and is currently estimated at $317,221, approximately $222 per square foot. 7380 Southern Hills Ct is a home located in Fairfield County with nearby schools including Tussing Elementary School, Harmon Middle School, and Pickerington Lakeview Junior High School.
Ownership History
Date
Name
Owned For
Owner Type
Purchase Details
Closed on
Jul 2, 2020
Sold by
Stickney Sharon J and Smyth Colin N
Bought by
Ba Amadou M and Niang Sokhna
Current Estimated Value
Home Financials for this Owner
Home Financials are based on the most recent Mortgage that was taken out on this home.
Original Mortgage
$192,449
Outstanding Balance
$170,651
Interest Rate
3.1%
Mortgage Type
FHA
Estimated Equity
$146,570
Purchase Details
Closed on
Apr 14, 1999
Sold by
Self Michael A
Bought by
Smyth Norman and Smyth Maud A
Home Financials for this Owner
Home Financials are based on the most recent Mortgage that was taken out on this home.
Original Mortgage
$92,800
Interest Rate
7.1%
Mortgage Type
New Conventional
Purchase Details
Closed on
Apr 27, 1992
Bought by
M/I Schottenstein Homes Inc
Purchase Details
Closed on
Jan 28, 1992
Bought by
M/I Schottenstein Homes Inc
Create a Home Valuation Report for This Property
The Home Valuation Report is an in-depth analysis detailing your home's value as well as a comparison with similar homes in the area
Home Values in the Area
Average Home Value in this Area
Purchase History
| Date | Buyer | Sale Price | Title Company |
|---|---|---|---|
| Ba Amadou M | $198,500 | Access Title Agency | |
| Smyth Norman | $116,000 | -- | |
| M/I Schottenstein Homes Inc | $94,700 | -- | |
| M/I Schottenstein Homes Inc | -- | -- |
Source: Public Records
Mortgage History
| Date | Status | Borrower | Loan Amount |
|---|---|---|---|
| Open | Ba Amadou M | $192,449 | |
| Previous Owner | Smyth Norman | $92,800 |
Source: Public Records
Tax History Compared to Growth
Tax History
| Year | Tax Paid | Tax Assessment Tax Assessment Total Assessment is a certain percentage of the fair market value that is determined by local assessors to be the total taxable value of land and additions on the property. | Land | Improvement |
|---|---|---|---|---|
| 2024 | $6,839 | $69,470 | $16,140 | $53,330 |
| 2023 | $2,703 | $69,470 | $16,140 | $53,330 |
| 2022 | $2,710 | $69,470 | $16,140 | $53,330 |
| 2021 | $2,719 | $60,180 | $12,450 | $47,730 |
| 2020 | $2,821 | $60,180 | $12,450 | $47,730 |
| 2019 | $2,841 | $60,180 | $12,450 | $47,730 |
| 2018 | $2,478 | $49,490 | $12,450 | $37,040 |
| 2017 | $2,252 | $51,940 | $12,460 | $39,480 |
| 2016 | $2,235 | $51,940 | $12,460 | $39,480 |
| 2015 | $2,024 | $45,920 | $10,840 | $35,080 |
| 2014 | $1,992 | $45,920 | $10,840 | $35,080 |
| 2013 | $1,992 | $45,920 | $10,840 | $35,080 |
Source: Public Records
Map
Nearby Homes
- 3212 Southern Hills Dr
- 3205 Mahaffey Ct
- 3233 Mahaffey Ct
- 3161 Innisbrook Ct
- 7350 Aplin Dr
- 3021 Sumner Dr
- 7287 Candlestone Dr
- 3099 Ambarwent Rd
- 7619 Kittansett Ln
- 7673 Harbour Town Dr
- 2909 Princeville Dr
- 7640 Kittansett Ln
- 3088 Alderbrook Dr
- 2968 Stone Mountain Dr
- 2961 Stone Mountain Dr
- 3139 Highland Park Dr
- 3077 Highland Park Dr
- 2916 Princeville Dr
- 3072 Bocastle Ct
- 7611 Bay Hill Dr
- 7372 Southern Hills Ct
- 3171 Southern Hills Dr
- 3165 Southern Hills Dr
- 3159 Southern Hills Dr
- 7375 Southern Hills Ct
- 7383 Southern Hills Ct
- 7350 Arborlee Dr
- 3153 Southern Hills Dr
- 3189 Southern Hills Dr
- 3168 Southern Hills Dr
- 3176 Southern Hills Dr
- 7356 Arborlee Dr
- 3160 Southern Hills Dr
- 7353 Fallow Trail Dr
- 3184 Southern Hills Dr
- 3147 Southern Hills Dr
- 7362 Arborlee Dr
- 7344 Arborlee Dr
- 3200 Mahaffey Ct
- 3192 Southern Hills Dr