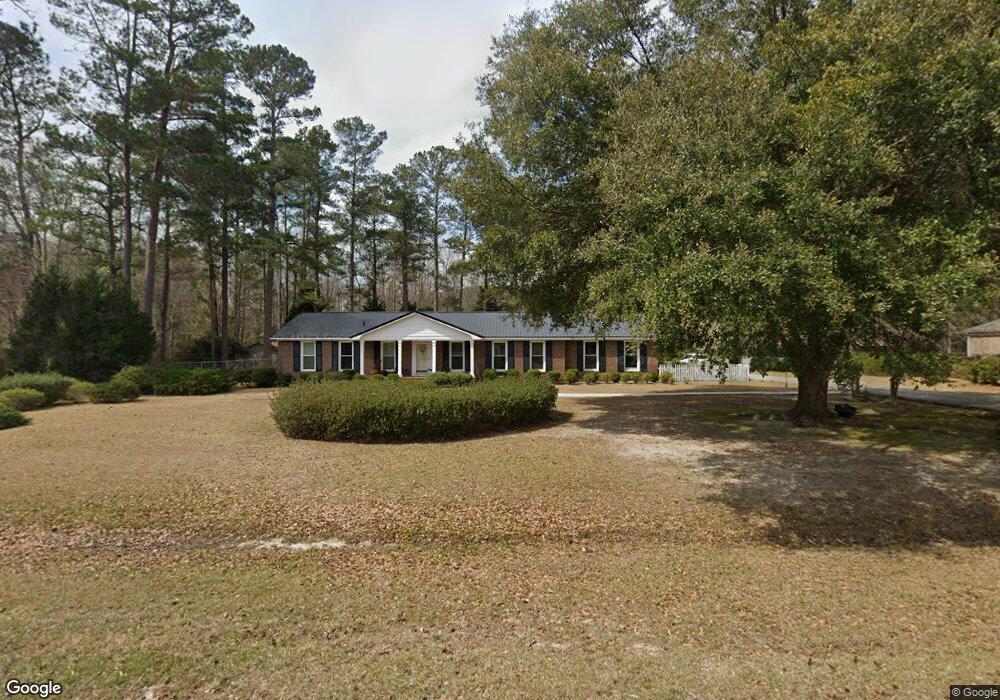
739 Patriots Way Orangeburg, SC 29118
Estimated Value: $92,000 - $142,871
3
Beds
1
Bath
1,851
Sq Ft
$66/Sq Ft
Est. Value
About This Home
This home is located at 739 Patriots Way, Orangeburg, SC 29118 and is currently estimated at $121,468, approximately $65 per square foot. 739 Patriots Way is a home located in Orangeburg County with nearby schools including Marshall Elementary School, Marshall Elementary, and William J. Clark Middle School.
Ownership History
Date
Name
Owned For
Owner Type
Purchase Details
Closed on
Jul 28, 2022
Sold by
Andre Lourdes S
Bought by
Andre Lourdes S and Sebazco Odelta H
Current Estimated Value
Purchase Details
Closed on
Mar 2, 2007
Sold by
Paul Ramdeen Nancy
Bought by
Andre Lourdes S and Sebazco Odelta
Purchase Details
Closed on
Jun 21, 2006
Sold by
Hudson Robert L and Ross Terry Ann
Bought by
Paul Ramdeen Nancy
Purchase Details
Closed on
Apr 4, 2006
Sold by
Paul Ramdeen Nancy
Bought by
Hudson Robert L and Ross Terry Ann
Purchase Details
Closed on
Mar 28, 2006
Sold by
Abdullah Aazim R
Bought by
Paul Ramdeen Nancy
Purchase Details
Closed on
Mar 21, 2006
Sold by
Daniels Lynwood K and Abdullah Aazim R
Bought by
Abdullah Aazim R
Purchase Details
Closed on
Feb 2, 2000
Sold by
Hadwin Susan Watkins
Bought by
Abdullah Aazim R
Create a Home Valuation Report for This Property
The Home Valuation Report is an in-depth analysis detailing your home's value as well as a comparison with similar homes in the area
Home Values in the Area
Average Home Value in this Area
Purchase History
| Date | Buyer | Sale Price | Title Company |
|---|---|---|---|
| Andre Lourdes S | -- | None Listed On Document | |
| Andre Lourdes S | $55,000 | None Available | |
| Paul Ramdeen Nancy | -- | None Available | |
| Hudson Robert L | -- | None Available | |
| Paul Ramdeen Nancy | $45,000 | None Available | |
| Abdullah Aazim R | -- | None Available | |
| Abdullah Aazim R | -- | -- | |
| Abdullah Aazim R | -- | -- | |
| Abdullah Aazim R | $40,000 | -- |
Source: Public Records
Tax History Compared to Growth
Tax History
| Year | Tax Paid | Tax Assessment Tax Assessment Total Assessment is a certain percentage of the fair market value that is determined by local assessors to be the total taxable value of land and additions on the property. | Land | Improvement |
|---|---|---|---|---|
| 2024 | $3,188 | $6,862 | $1,126 | $5,736 |
| 2023 | $2,815 | $5,506 | $1,066 | $4,440 |
| 2022 | $2,704 | $5,506 | $1,066 | $4,440 |
| 2021 | $2,693 | $5,506 | $1,066 | $4,440 |
| 2020 | $2,517 | $5,506 | $0 | $0 |
| 2019 | $2,451 | $5,506 | $0 | $0 |
| 2018 | $2,470 | $5,212 | $0 | $0 |
| 2017 | $2,418 | $5,212 | $0 | $0 |
| 2016 | $2,420 | $5,212 | $0 | $0 |
| 2015 | $1,888 | $5,212 | $0 | $0 |
| 2014 | $1,888 | $5,213 | $1,067 | $4,146 |
| 2013 | -- | $3,491 | $711 | $2,780 |
Source: Public Records
Map
Nearby Homes
- 783 Patriots Way
- 3171 Queensway
- 0 Off Rd N Unit 25023017
- 1 Worthington Dr
- 2395 Lakeside St
- 2220 Hillside St NE
- 2220 Hillside St
- 2753 Hillcrest Ave
- 2753 Hillcrest St NE
- 2136 Pinnacle St
- 00 Riley St
- 0 Riley St
- 2778 Riley St
- 2358 Northview Dr Unit 2B
- 2354 Northview Dr Unit 2A
- 2336 Northview Dr Unit 3-C
- 2348 Northview Dr Unit 3F
- 2251 Hillcrest Ave Unit 6C
- 2415 Riley St
- 2320 Mall Terrace Ct Unit 2320
- 739 Patriots Way
- 739 Patriots Way
- 739 Patriots Way
- 739 Patriots Way
- 739 Patriots Way
- 751 Patriots Way
- 0 Patriots Way Unit 904335
- 0 Patriots Way Unit 904084
- 0 Patriots Way Unit 903979
- 0 Patriots Way Unit 903978
- 0 Patriots Way Unit 903779
- 0 Patriots Way Unit (21) 148221
- 0 Patriots Way Unit 43771
- 0 Patriots Way Unit 43770
- 0 Patriots Way Unit 43769
- 0 Patriots Way Unit 43768
- 0 Patriots Way Unit 40517
- 0 Patriots Way
- 786 Patriots Way
- 788 Patriots Way