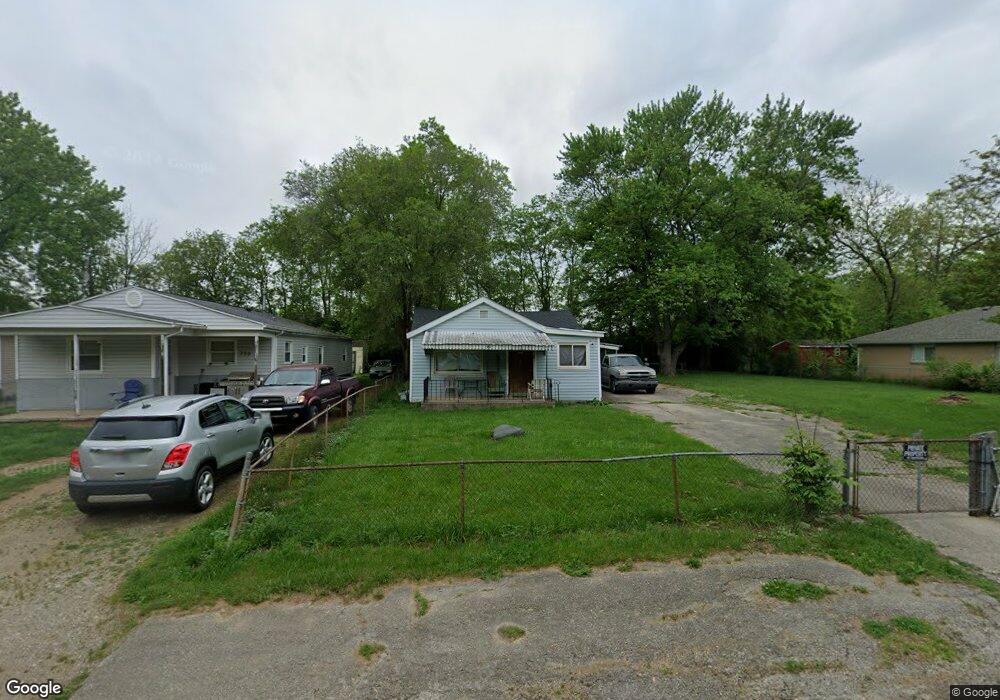
739 Sagamore Ave Dayton, OH 45404
Old North Dayton NeighborhoodEstimated Value: $90,000 - $123,688
3
Beds
1
Bath
1,248
Sq Ft
$85/Sq Ft
Est. Value
About This Home
This home is located at 739 Sagamore Ave, Dayton, OH 45404 and is currently estimated at $105,922, approximately $84 per square foot. 739 Sagamore Ave is a home located in Montgomery County with nearby schools including Stebbins High School, Pathway School of Discovery, and Horizon Science Academy Dayton Downtown.
Ownership History
Date
Name
Owned For
Owner Type
Purchase Details
Closed on
Feb 16, 2022
Sold by
Shelton Byron
Bought by
Pty Sec
Current Estimated Value
Purchase Details
Closed on
Dec 13, 2021
Sold by
Kilhstrom John S
Bought by
Shelton Byron
Purchase Details
Closed on
Jul 24, 2021
Sold by
Evp Holdings Llc
Bought by
Kihistrom John
Purchase Details
Closed on
Sep 12, 2018
Sold by
Okinbia Investment Properties Llc
Bought by
Evp Holdings Llc
Purchase Details
Closed on
Jul 31, 2018
Sold by
Lucas Joseph C
Bought by
Okinbia Investments Properties Llc
Purchase Details
Closed on
Jul 2, 2014
Sold by
Lay Donald M and Lay Arbutus
Bought by
Lucas Joseph C
Purchase Details
Closed on
Jul 2, 2001
Sold by
Lay Donald M and Lay Arbutus
Bought by
Brock Paul and Lewis Stella
Home Financials for this Owner
Home Financials are based on the most recent Mortgage that was taken out on this home.
Original Mortgage
$65,307
Interest Rate
10%
Mortgage Type
Seller Take Back
Create a Home Valuation Report for This Property
The Home Valuation Report is an in-depth analysis detailing your home's value as well as a comparison with similar homes in the area
Home Values in the Area
Average Home Value in this Area
Purchase History
| Date | Buyer | Sale Price | Title Company |
|---|---|---|---|
| Pty Sec | $5,582 | None Listed On Document | |
| Shelton Byron | -- | -- | |
| Kihistrom John | $50,000 | None Available | |
| Evp Holdings Llc | $12,300 | None Available | |
| Okinbia Investments Properties Llc | $18,475 | None Available | |
| Lucas Joseph C | $1,000 | None Available | |
| Brock Paul | $65,307 | -- |
Source: Public Records
Mortgage History
| Date | Status | Borrower | Loan Amount |
|---|---|---|---|
| Previous Owner | Brock Paul | $65,307 |
Source: Public Records
Tax History Compared to Growth
Tax History
| Year | Tax Paid | Tax Assessment Tax Assessment Total Assessment is a certain percentage of the fair market value that is determined by local assessors to be the total taxable value of land and additions on the property. | Land | Improvement |
|---|---|---|---|---|
| 2024 | $1,208 | $24,920 | $1,820 | $23,100 |
| 2023 | $1,208 | $24,920 | $1,820 | $23,100 |
| 2022 | $1,131 | $17,420 | $1,270 | $16,150 |
| 2021 | $1,153 | $17,420 | $1,270 | $16,150 |
| 2020 | $1,182 | $17,420 | $1,270 | $16,150 |
| 2019 | $1,362 | $14,070 | $1,270 | $12,800 |
| 2018 | $1,434 | $14,070 | $1,270 | $12,800 |
| 2017 | $1,076 | $14,070 | $1,270 | $12,800 |
| 2016 | $1,176 | $14,960 | $1,270 | $13,690 |
| 2015 | $1,443 | $14,960 | $1,270 | $13,690 |
| 2014 | $1,443 | $14,960 | $1,270 | $13,690 |
| 2012 | -- | $19,380 | $1,270 | $18,110 |
Source: Public Records
Map
Nearby Homes
- - Prince Albert Blvd
- -- Prince Albert Blvd
- - Rondowa Ave
- -- Rondowa Ave
- 2249 Prince Albert Blvd
- 2249 Valley Pike
- 2245 Valley Pike
- 518 Tyron Ave
- 546 Wynora Ave
- 29 Barcelona Ave
- 641 Prince Albert Blvd
- 2460 Bushnell Ave
- -- Valley Pike
- - Valley Pike
- 2249 - Valley Pike
- 2301 Valley Pike
- 241 Community Dr
- 1930 Brandt Pike
- 34 Ingleside Ave
- 3586 Lane Garden Ct
- 735 Sagamore Ave
- 745 Sagamore Ave
- 733 Sagamore Ave
- 751 Sagamore Ave
- 727 Sagamore Ave
- 744 Sagamore Ave
- 736 Sagamore Ave
- 730 Sagamore Ave
- 725 Sagamore Ave
- 748 Sagamore Ave
- 728 Sagamore Ave
- 752 Sagamore Ave
- 724 Sagamore Ave
- 717 Sagamore Ave
- 805 Sagamore Ave
- 720 Sagamore Ave
- 715 Sagamore Ave
- 800 Sagamore Ave
- 2151 Forest Home Ave
- 716 Sagamore Ave