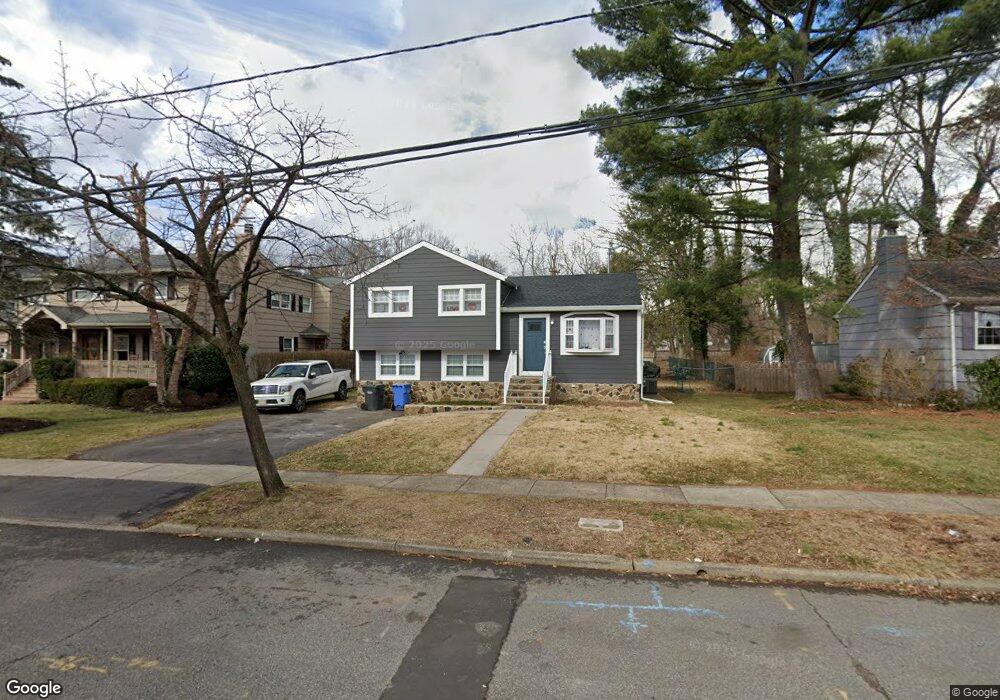
74 Christol St Metuchen, NJ 08840
Estimated Value: $669,423 - $753,000
3
Beds
2
Baths
1,258
Sq Ft
$560/Sq Ft
Est. Value
About This Home
This home is located at 74 Christol St, Metuchen, NJ 08840 and is currently estimated at $704,606, approximately $560 per square foot. 74 Christol St is a home located in Middlesex County with nearby schools including Campbell Elementary School, Edgar Middle School, and Metuchen High School.
Ownership History
Date
Name
Owned For
Owner Type
Purchase Details
Closed on
Aug 29, 2018
Sold by
Mtgoq Investors Lp
Bought by
Londono Jose A and Londono Johanny Hernandez
Current Estimated Value
Home Financials for this Owner
Home Financials are based on the most recent Mortgage that was taken out on this home.
Original Mortgage
$307,800
Outstanding Balance
$267,867
Interest Rate
4.5%
Mortgage Type
New Conventional
Estimated Equity
$436,739
Purchase Details
Closed on
Dec 15, 2017
Sold by
Brant Carol and Brant Michael
Bought by
Ditech Financila Llc and Mtglq Investors Lp
Purchase Details
Closed on
Apr 4, 2007
Create a Home Valuation Report for This Property
The Home Valuation Report is an in-depth analysis detailing your home's value as well as a comparison with similar homes in the area
Home Values in the Area
Average Home Value in this Area
Purchase History
| Date | Buyer | Sale Price | Title Company |
|---|---|---|---|
| Londono Jose A | $342,000 | Old Republic National Title | |
| Ditech Financila Llc | -- | None Available | |
| -- | -- | -- |
Source: Public Records
Mortgage History
| Date | Status | Borrower | Loan Amount |
|---|---|---|---|
| Open | Londono Jose A | $307,800 |
Source: Public Records
Tax History Compared to Growth
Tax History
| Year | Tax Paid | Tax Assessment Tax Assessment Total Assessment is a certain percentage of the fair market value that is determined by local assessors to be the total taxable value of land and additions on the property. | Land | Improvement |
|---|---|---|---|---|
| 2025 | $11,990 | $172,400 | $93,000 | $79,400 |
| 2024 | $11,091 | $172,400 | $93,000 | $79,400 |
| 2023 | $11,091 | $165,000 | $93,000 | $72,000 |
| 2022 | $10,512 | $165,000 | $93,000 | $72,000 |
| 2021 | $7,658 | $165,000 | $93,000 | $72,000 |
| 2020 | $10,136 | $165,000 | $93,000 | $72,000 |
| 2019 | $9,837 | $165,000 | $93,000 | $72,000 |
| 2018 | $9,801 | $165,000 | $93,000 | $72,000 |
| 2017 | $9,770 | $165,000 | $93,000 | $72,000 |
| 2016 | $9,521 | $165,000 | $93,000 | $72,000 |
| 2015 | $9,242 | $163,800 | $92,100 | $71,700 |
| 2014 | $9,011 | $163,800 | $92,100 | $71,700 |
Source: Public Records
Map
Nearby Homes