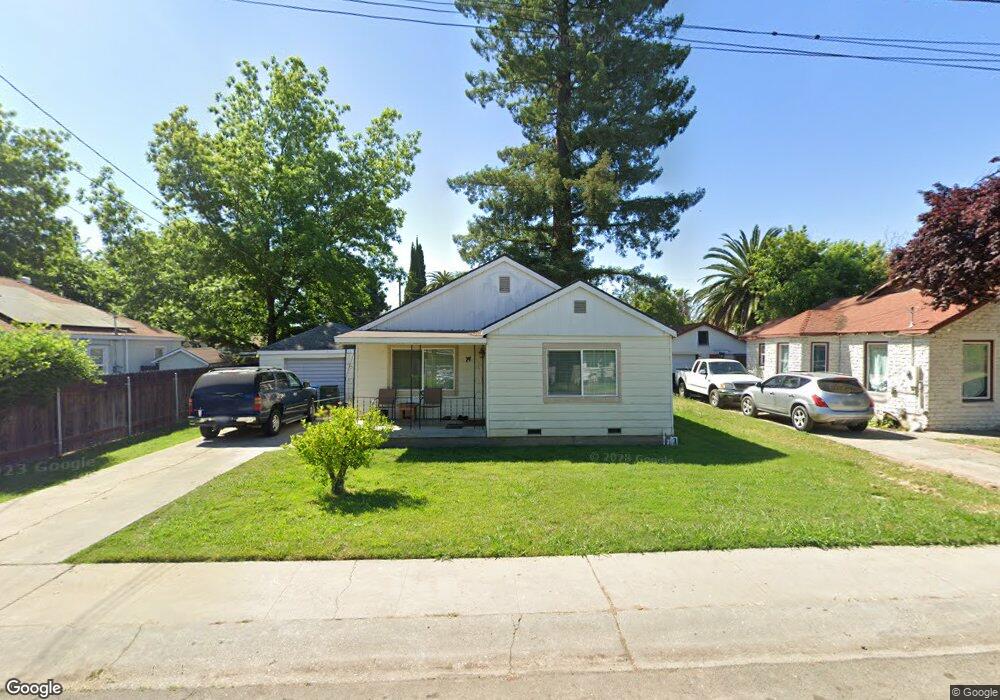
74 Neilson Ave Yuba City, CA 95991
Estimated Value: $223,000 - $294,000
2
Beds
1
Bath
1,008
Sq Ft
$269/Sq Ft
Est. Value
About This Home
This home is located at 74 Neilson Ave, Yuba City, CA 95991 and is currently estimated at $270,714, approximately $268 per square foot. 74 Neilson Ave is a home located in Sutter County with nearby schools including Park Avenue Elementary School, Gray Avenue Middle School, and Yuba City High School.
Ownership History
Date
Name
Owned For
Owner Type
Purchase Details
Closed on
Sep 14, 2020
Sold by
Orozco Juan and Orozco Juan
Bought by
Orozco Juan
Current Estimated Value
Purchase Details
Closed on
Jul 2, 2003
Sold by
Orozco Maria
Bought by
Orozco Juan
Home Financials for this Owner
Home Financials are based on the most recent Mortgage that was taken out on this home.
Original Mortgage
$92,900
Interest Rate
5.18%
Mortgage Type
Purchase Money Mortgage
Create a Home Valuation Report for This Property
The Home Valuation Report is an in-depth analysis detailing your home's value as well as a comparison with similar homes in the area
Home Values in the Area
Average Home Value in this Area
Purchase History
| Date | Buyer | Sale Price | Title Company |
|---|---|---|---|
| Orozco Juan | -- | Orozco Juan | |
| Orozco Juan | -- | Bidwell Title & Escrow Co | |
| Orozco Juan | -- | Bidwell Title & Escrow Co |
Source: Public Records
Mortgage History
| Date | Status | Borrower | Loan Amount |
|---|---|---|---|
| Previous Owner | Orozco Juan | $92,900 |
Source: Public Records
Tax History Compared to Growth
Tax History
| Year | Tax Paid | Tax Assessment Tax Assessment Total Assessment is a certain percentage of the fair market value that is determined by local assessors to be the total taxable value of land and additions on the property. | Land | Improvement |
|---|---|---|---|---|
| 2025 | $1,191 | $107,983 | $25,068 | $82,915 |
| 2024 | $1,191 | $105,867 | $24,577 | $81,290 |
| 2023 | $1,191 | $103,793 | $24,096 | $79,697 |
| 2022 | $1,132 | $101,759 | $23,624 | $78,135 |
| 2021 | $1,118 | $99,790 | $23,173 | $76,617 |
| 2020 | $1,098 | $98,767 | $22,936 | $75,831 |
| 2019 | $1,074 | $96,830 | $22,486 | $74,344 |
| 2018 | $1,057 | $94,931 | $22,045 | $72,886 |
| 2017 | $1,030 | $93,070 | $21,613 | $71,457 |
| 2016 | $961 | $87,000 | $35,000 | $52,000 |
| 2015 | $880 | $79,800 | $31,500 | $48,300 |
| 2014 | $845 | $76,000 | $30,000 | $46,000 |
Source: Public Records
Map
Nearby Homes