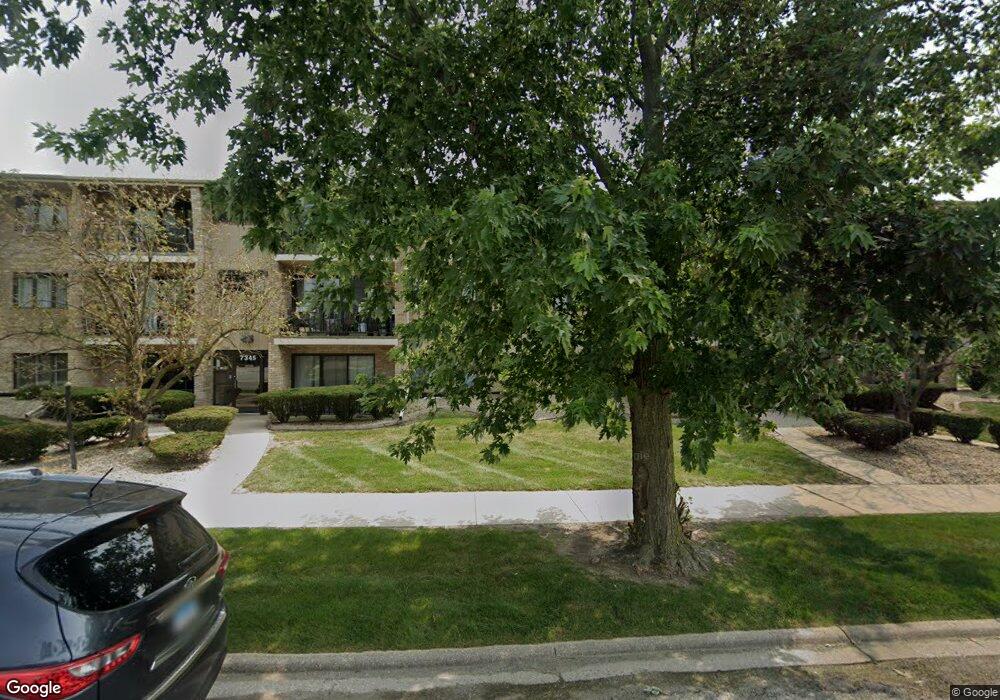
7401 Tiffany Dr Unit 4W Orland Park, IL 60462
Silver Lake South NeighborhoodEstimated Value: $183,000 - $211,767
5
Beds
2
Baths
1,400
Sq Ft
$142/Sq Ft
Est. Value
About This Home
This home is located at 7401 Tiffany Dr Unit 4W, Orland Park, IL 60462 and is currently estimated at $199,442, approximately $142 per square foot. 7401 Tiffany Dr Unit 4W is a home located in Cook County with nearby schools including Arnold W Kruse Education Center, Central Middle School, and Victor J Andrew High School.
Ownership History
Date
Name
Owned For
Owner Type
Purchase Details
Closed on
Oct 11, 2018
Sold by
First Midwest Bank
Bought by
Karaki Safwan M
Current Estimated Value
Purchase Details
Closed on
Sep 19, 2016
Sold by
Miller Loretta
Bought by
First Midwest Bank and Trust Number 9277
Purchase Details
Closed on
Mar 25, 2004
Sold by
Dixon Mary Kay
Bought by
Miller Loretta
Purchase Details
Closed on
Jun 26, 2001
Sold by
Salinas Jose C and Salinas Deanna
Bought by
Dixon Mary Kay
Home Financials for this Owner
Home Financials are based on the most recent Mortgage that was taken out on this home.
Original Mortgage
$108,640
Interest Rate
7.22%
Purchase Details
Closed on
Aug 31, 1993
Sold by
Diorio Dominic and Diorio Joanna
Bought by
Salinas Jose C and Salinas Deanna
Home Financials for this Owner
Home Financials are based on the most recent Mortgage that was taken out on this home.
Original Mortgage
$67,425
Interest Rate
7.22%
Create a Home Valuation Report for This Property
The Home Valuation Report is an in-depth analysis detailing your home's value as well as a comparison with similar homes in the area
Home Values in the Area
Average Home Value in this Area
Purchase History
| Date | Buyer | Sale Price | Title Company |
|---|---|---|---|
| Karaki Safwan M | $120,000 | Attorneys Title Guaranty Fun | |
| First Midwest Bank | -- | Attorney | |
| Miller Loretta | $147,000 | Bt | |
| Dixon Mary Kay | $112,000 | -- | |
| Salinas Jose C | $59,333 | -- |
Source: Public Records
Mortgage History
| Date | Status | Borrower | Loan Amount |
|---|---|---|---|
| Previous Owner | Dixon Mary Kay | $108,640 | |
| Previous Owner | Salinas Jose C | $67,425 |
Source: Public Records
Tax History Compared to Growth
Tax History
| Year | Tax Paid | Tax Assessment Tax Assessment Total Assessment is a certain percentage of the fair market value that is determined by local assessors to be the total taxable value of land and additions on the property. | Land | Improvement |
|---|---|---|---|---|
| 2024 | $3,939 | $13,489 | $1,629 | $11,860 |
| 2023 | $2,768 | $13,489 | $1,629 | $11,860 |
| 2022 | $2,768 | $7,763 | $1,434 | $6,329 |
| 2021 | $2,713 | $7,761 | $1,433 | $6,328 |
| 2020 | $2,895 | $8,327 | $1,433 | $6,894 |
| 2019 | $3,101 | $8,869 | $1,303 | $7,566 |
| 2018 | $2,127 | $12,394 | $1,303 | $11,091 |
| 2017 | $4,150 | $12,394 | $1,303 | $11,091 |
| 2016 | $2,242 | $11,176 | $1,172 | $10,004 |
| 2015 | $2,327 | $11,176 | $1,172 | $10,004 |
| 2014 | $1,697 | $11,176 | $1,172 | $10,004 |
| 2013 | $2,242 | $11,588 | $1,172 | $10,416 |
Source: Public Records
Map
Nearby Homes
- 7405 W 157th St
- 15662 Wild Rose Ln Unit 12
- 15602 Violet Ct Unit 31
- 16447 S 76th Ave
- 7686 159th Place Unit 38
- 7732 W 158th Ct Unit 7732
- 7747 Cashew Dr
- 15340 Aubrieta Ln Unit 52
- 7503 161st Place
- 7823 W 157th Place Unit 1W
- 7533 161st Place
- 16139 Lake Villa Ave
- 15346 Heather Ct
- 15337 Heather Ct
- 15262 S 74th Ave Unit 36
- 15253 S 74th Ct Unit 42
- 15957 78th Ave
- 15962 78th Ave
- 15459 S 70th Ct
- 7911 W 157th St Unit 2W
- 7401 Tiffany Dr Unit 6W
- 7401 Tiffany Dr Unit 5W
- 7401 Tiffany Dr Unit 3W
- 7401 Tiffany Dr Unit 1W
- 7401 Tiffany Dr Unit 2W
- 7401 Tiffany Dr Unit 2E
- 7345 Tiffany Dr Unit 6E
- 7345 Tiffany Dr Unit 3E
- 7345 Tiffany Dr Unit 5E
- 7345 Tiffany Dr Unit 4E
- 7345 Tiffany Dr Unit 1W
- 7345 Tiffany Dr Unit 3W
- 7405 Tiffany Dr Unit 3WF
- 7405 Tiffany Dr Unit 2EF
- 7405 Tiffany Dr Unit 3WR
- 7405 Tiffany Dr Unit 2WR
- 7405 Tiffany Dr Unit 2ER
- 7405 Tiffany Dr Unit 1WF
- 7405 Tiffany Dr Unit 3EF
- 7405 Tiffany Dr Unit 3ER