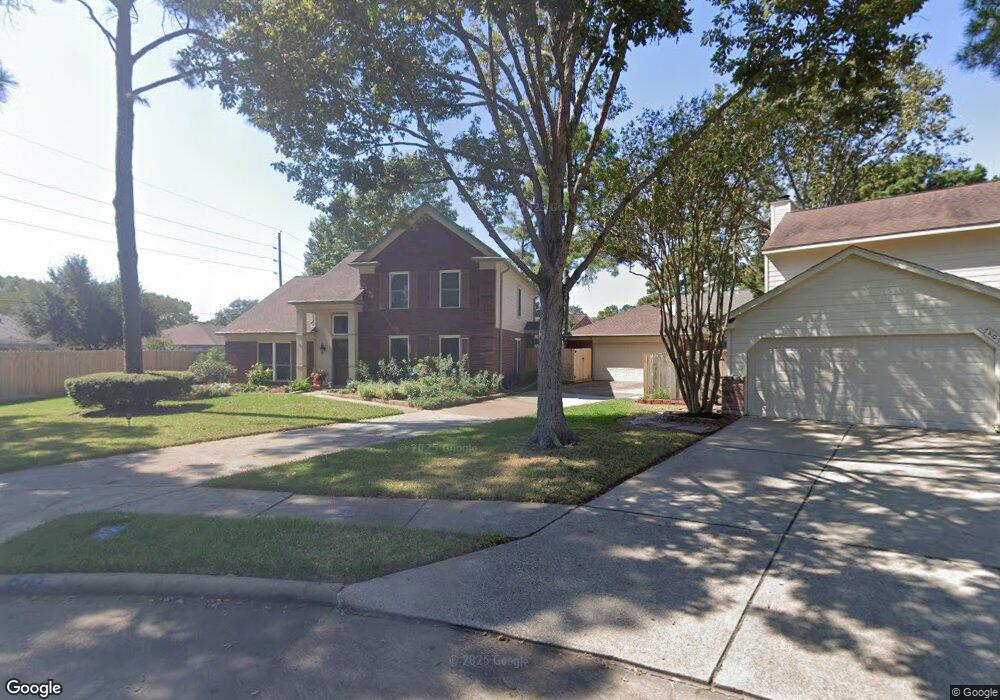
7403 Magnolia Shadows Ln Houston, TX 77095
Copperfield NeighborhoodEstimated Value: $322,778 - $335,000
4
Beds
3
Baths
2,272
Sq Ft
$145/Sq Ft
Est. Value
About This Home
This home is located at 7403 Magnolia Shadows Ln, Houston, TX 77095 and is currently estimated at $328,695, approximately $144 per square foot. 7403 Magnolia Shadows Ln is a home located in Harris County with nearby schools including Lowery Elementary School, Aragon Middle School, and Langham Creek High School.
Ownership History
Date
Name
Owned For
Owner Type
Purchase Details
Closed on
Dec 14, 2000
Sold by
Zwan Alphonse G and Zwan Darlene M
Bought by
Allen Daren E and Allen Donna W
Current Estimated Value
Home Financials for this Owner
Home Financials are based on the most recent Mortgage that was taken out on this home.
Original Mortgage
$115,515
Outstanding Balance
$42,875
Interest Rate
7.8%
Estimated Equity
$285,820
Purchase Details
Closed on
Aug 27, 1999
Sold by
Odell Robert D and Odell Jennifer L
Bought by
Zwan Alphonse G and Zwan Darlene M
Home Financials for this Owner
Home Financials are based on the most recent Mortgage that was taken out on this home.
Original Mortgage
$105,520
Interest Rate
7.58%
Purchase Details
Closed on
Sep 29, 1993
Sold by
Accomando Mike P and Accomando Julia
Bought by
Odell Robert D and Odell Jennifer L
Home Financials for this Owner
Home Financials are based on the most recent Mortgage that was taken out on this home.
Original Mortgage
$91,200
Interest Rate
7.11%
Create a Home Valuation Report for This Property
The Home Valuation Report is an in-depth analysis detailing your home's value as well as a comparison with similar homes in the area
Home Values in the Area
Average Home Value in this Area
Purchase History
| Date | Buyer | Sale Price | Title Company |
|---|---|---|---|
| Allen Daren E | -- | American Title Co | |
| Zwan Alphonse G | -- | -- | |
| Odell Robert D | -- | -- |
Source: Public Records
Mortgage History
| Date | Status | Borrower | Loan Amount |
|---|---|---|---|
| Open | Allen Daren E | $115,515 | |
| Previous Owner | Zwan Alphonse G | $105,520 | |
| Previous Owner | Odell Robert D | $91,200 |
Source: Public Records
Tax History Compared to Growth
Tax History
| Year | Tax Paid | Tax Assessment Tax Assessment Total Assessment is a certain percentage of the fair market value that is determined by local assessors to be the total taxable value of land and additions on the property. | Land | Improvement |
|---|---|---|---|---|
| 2025 | $1,681 | $286,196 | $79,925 | $206,271 |
| 2024 | $1,681 | $286,196 | $69,500 | $216,696 |
| 2023 | $1,681 | $296,607 | $69,500 | $227,107 |
| 2022 | $5,855 | $268,868 | $49,519 | $219,349 |
| 2021 | $5,626 | $221,748 | $49,519 | $172,229 |
| 2020 | $5,638 | $215,431 | $41,266 | $174,165 |
| 2019 | $5,660 | $209,405 | $41,266 | $168,139 |
| 2018 | $1,884 | $194,825 | $41,266 | $153,559 |
| 2017 | $5,287 | $194,825 | $41,266 | $153,559 |
| 2016 | $5,287 | $194,825 | $41,266 | $153,559 |
| 2015 | $3,699 | $183,828 | $41,266 | $142,562 |
| 2014 | $3,699 | $168,715 | $36,053 | $132,662 |
Source: Public Records
Map
Nearby Homes
- 16734 Pebbleglen Dr
- 7510 Dogwood Falls Rd
- 7311 Barton Oaks Dr
- 16911 Shady Square Ct
- 7306 Bubbling Brooks Ln
- 7607 Plumtree Forest Cir
- 7254 Sonnet Glen Ln
- 7539 Wildwood Brook Ct
- 7519 Sunlight Ln
- 17010 Poplar Hill St
- 16502 Rainbow Lake Rd
- 16902 Terrace Park Dr
- 7307 Sunlight Ln
- 17206 Haley Falls Ln
- 17222 Crown Meadow Ct
- 17230 Valhallah Way
- 7719 Woodlett Ct
- 16346 Pebbleglen Dr
- 7215 Daylight Ln
- 17015 Sky Blue Place
- 7407 Magnolia Shadows Ln
- 16738 Maplemont Dr
- 16742 Maplemont Dr
- 7426 Shangrila Ln
- 16734 Maplemont Dr
- 16746 Maplemont Dr
- 7430 Shangrila Ln
- 7422 Shangrila Ln
- 7411 Magnolia Shadows Ln
- 16730 Maplemont Dr
- 7434 Shangrila Ln
- 16750 Maplemont Dr
- 7410 Magnolia Shadows Ln
- 7415 Magnolia Shadows Ln
- 16726 Maplemont Dr
- 7438 Shangrila Ln
- 7414 Magnolia Shadows Ln
- 16754 Maplemont Dr
- 16739 Maplemont Dr
- 16735 Maplemont Dr