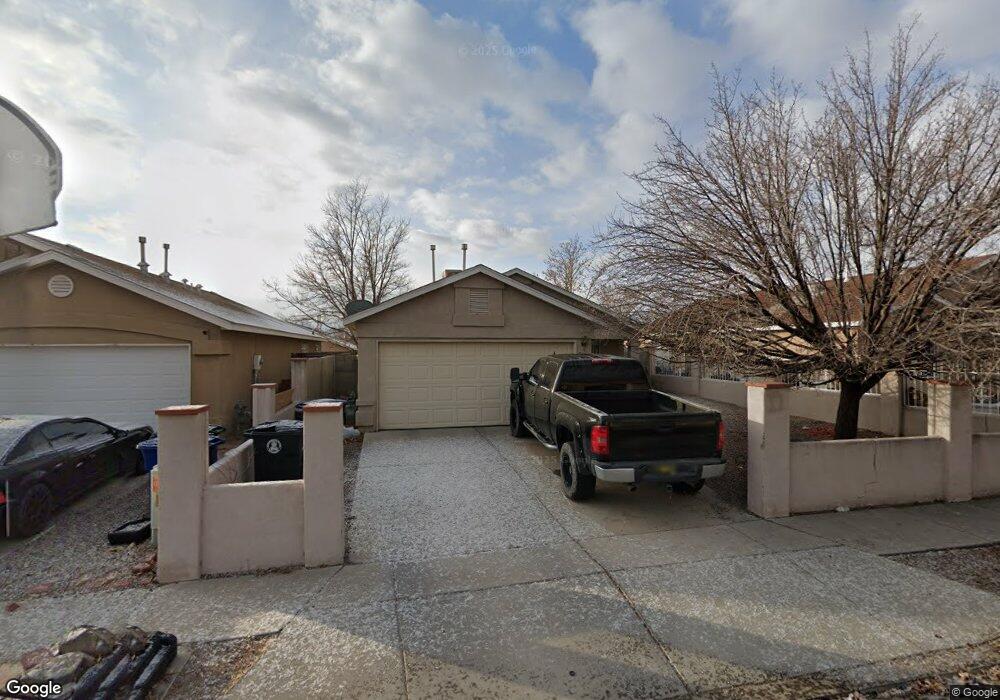
7404 Blue Avena Ave SW Albuquerque, NM 87121
Southwest Heights NeighborhoodEstimated Value: $238,000 - $279,000
3
Beds
2
Baths
1,172
Sq Ft
$225/Sq Ft
Est. Value
About This Home
This home is located at 7404 Blue Avena Ave SW, Albuquerque, NM 87121 and is currently estimated at $263,796, approximately $225 per square foot. 7404 Blue Avena Ave SW is a home located in Bernalillo County with nearby schools including Maryann Binford Elementary School, Truman Middle School, and Rio Grande High School.
Ownership History
Date
Name
Owned For
Owner Type
Purchase Details
Closed on
Sep 12, 2022
Sold by
7404 Blue Llc
Bought by
7404 Blue 2020 Llc
Current Estimated Value
Purchase Details
Closed on
Mar 27, 2017
Sold by
Vanis Andrew
Bought by
7404 Blue Llc A New Mexico Company
Purchase Details
Closed on
Dec 20, 2007
Sold by
Rent Houses Llc
Bought by
Vanis Andrew
Purchase Details
Closed on
Sep 1, 2006
Sold by
The Unknown Heirs Of Jose Garner
Bought by
Fifth Third Mortgage Co
Purchase Details
Closed on
Feb 14, 2006
Sold by
Zamora Alfreida L Garner
Bought by
Rent Houses Llc
Purchase Details
Closed on
Jun 6, 2000
Sold by
Artistic Homes Inc
Bought by
Garner Jose L
Home Financials for this Owner
Home Financials are based on the most recent Mortgage that was taken out on this home.
Original Mortgage
$83,445
Interest Rate
8.13%
Mortgage Type
VA
Create a Home Valuation Report for This Property
The Home Valuation Report is an in-depth analysis detailing your home's value as well as a comparison with similar homes in the area
Home Values in the Area
Average Home Value in this Area
Purchase History
| Date | Buyer | Sale Price | Title Company |
|---|---|---|---|
| 7404 Blue 2020 Llc | -- | -- | |
| 7404 Blue Llc A New Mexico Company | -- | None Available | |
| Vanis Andrew | -- | Rio Grande Title Company Inc | |
| Fifth Third Mortgage Co | -- | None Available | |
| Rent Houses Llc | -- | Rio Grande Title Company Inc | |
| Garner Jose L | -- | First American Title Co |
Source: Public Records
Mortgage History
| Date | Status | Borrower | Loan Amount |
|---|---|---|---|
| Previous Owner | Garner Jose L | $83,445 |
Source: Public Records
Tax History Compared to Growth
Tax History
| Year | Tax Paid | Tax Assessment Tax Assessment Total Assessment is a certain percentage of the fair market value that is determined by local assessors to be the total taxable value of land and additions on the property. | Land | Improvement |
|---|---|---|---|---|
| 2025 | $1,733 | $42,303 | $10,307 | $31,996 |
| 2024 | $1,733 | $41,072 | $10,007 | $31,065 |
| 2023 | $1,704 | $39,876 | $9,716 | $30,160 |
| 2022 | $1,647 | $38,715 | $9,433 | $29,282 |
| 2021 | $1,591 | $37,587 | $9,158 | $28,429 |
| 2020 | $1,565 | $36,492 | $8,891 | $27,601 |
| 2019 | $1,519 | $35,429 | $8,632 | $26,797 |
| 2018 | $1,479 | $35,429 | $8,632 | $26,797 |
| 2017 | $1,310 | $34,729 | $8,632 | $26,097 |
| 2016 | $1,272 | $29,901 | $8,891 | $21,010 |
| 2015 | $29,030 | $29,030 | $8,632 | $20,398 |
| 2014 | $1,244 | $29,297 | $8,632 | $20,665 |
| 2013 | -- | $29,563 | $8,632 | $20,931 |
Source: Public Records
Map
Nearby Homes
- 7304 Autumn Sky Rd SW
- 7814 Desert Canyon Place SW
- 7901 Purple Fringe Rd SW
- 2503 Sancho Panza Way SW
- 1815 Shadetree Dr SW
- 1420 Summerfield Place SW
- 1615 Quiet Desert Dr SW
- 2528 Coors Blvd SW
- 7605 Windsong Place SW
- 2724 Barcelona Place SW
- 4301 Blake Trailer 40 Rd SW
- 2012 Foothill Dr SW
- 8600 Kimela Ct SW
- 3855 Villa Serena Place SW
- 1314 Tres Ritos St SW
- 0 Sage Rd SW Unit 1085259
- 2719 Procopio Place SW
- 0 Nwq Unser and Sage SW Unit 1081546
- 8524 Stony Creek Rd SW
- 1209 Locura Rd SW
- 7400 Blue Avena Ave SW
- 7408 Blue Avena Ave SW
- 7312 Blue Avena Ave SW
- 7412 Blue Avena Ave SW
- 7401 April Flower Place SW
- 7405 April Flower Place SW
- 7409 April Flower Place SW
- 7308 Blue Avena Ave SW
- 7315 April Flower Place SW
- 7401 Blue Avena Ave SW
- 7415 April Flower Place SW
- 7409 Blue Avena Ave SW
- 7500 Blue Avena Ave SW
- 7315 Blue Avena Ave SW
- 7415 Blue Avena Ave SW
- 7309 April Flower Place SW
- 7304 Blue Avena Ave SW
- 7501 April Flower Place SW
- 7504 Blue Avena Ave SW
- 7309 Blue Avena Ave SW