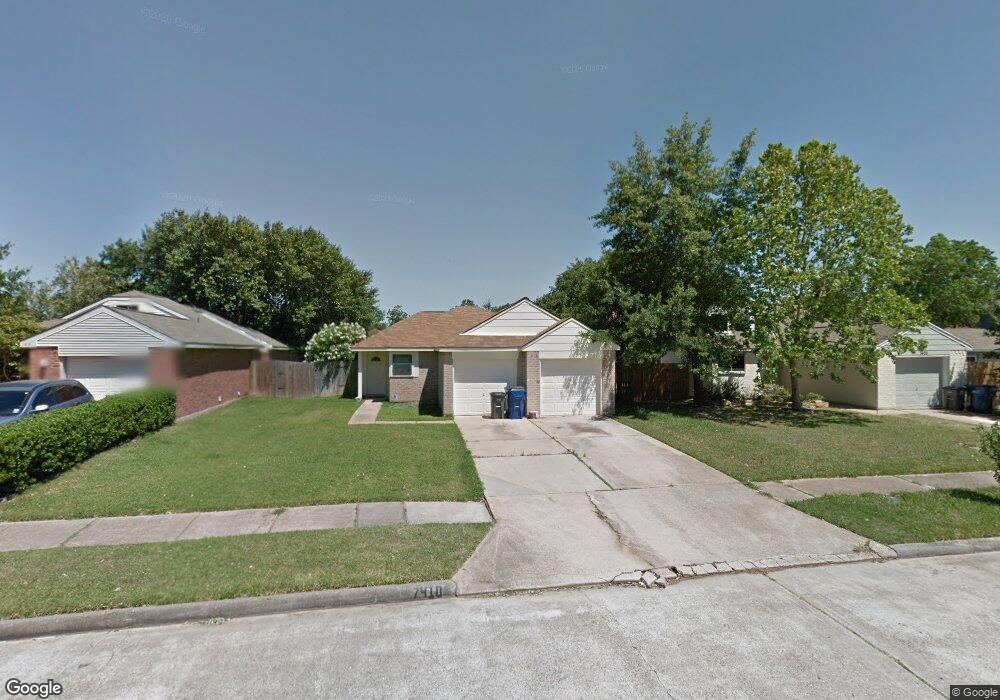
7410 Brookleaf Dr Houston, TX 77041
Hearthstone NeighborhoodEstimated Value: $224,202 - $241,000
2
Beds
2
Baths
1,467
Sq Ft
$158/Sq Ft
Est. Value
About This Home
This home is located at 7410 Brookleaf Dr, Houston, TX 77041 and is currently estimated at $231,801, approximately $158 per square foot. 7410 Brookleaf Dr is a home located in Harris County with nearby schools including Hairgrove Elementary School, Labay Middle School, and Cypress Falls High School.
Ownership History
Date
Name
Owned For
Owner Type
Purchase Details
Closed on
Dec 18, 2009
Sold by
Alvarez Martha R and Alvarez Ignacio
Bought by
Bravo Amalia
Current Estimated Value
Purchase Details
Closed on
May 22, 2002
Sold by
Lopez Catherine Diane Wallace and Lopez Julio Roberto
Bought by
Alvarez Martha R and Alvarez Ignacio
Home Financials for this Owner
Home Financials are based on the most recent Mortgage that was taken out on this home.
Original Mortgage
$93,005
Interest Rate
6.96%
Mortgage Type
Stand Alone First
Purchase Details
Closed on
Nov 22, 2000
Sold by
Wallace Catherine Diane and Lopez Catherine Diane Wallace
Bought by
Lopez Julio and Lopez Catherine Diane Wallace
Home Financials for this Owner
Home Financials are based on the most recent Mortgage that was taken out on this home.
Original Mortgage
$61,600
Interest Rate
7.72%
Mortgage Type
Credit Line Revolving
Create a Home Valuation Report for This Property
The Home Valuation Report is an in-depth analysis detailing your home's value as well as a comparison with similar homes in the area
Home Values in the Area
Average Home Value in this Area
Purchase History
| Date | Buyer | Sale Price | Title Company |
|---|---|---|---|
| Bravo Amalia | -- | First American Title | |
| Alvarez Martha R | -- | Startex Title Company | |
| Lopez Julio | -- | -- |
Source: Public Records
Mortgage History
| Date | Status | Borrower | Loan Amount |
|---|---|---|---|
| Previous Owner | Alvarez Martha R | $93,005 | |
| Previous Owner | Lopez Julio | $61,600 |
Source: Public Records
Tax History Compared to Growth
Tax History
| Year | Tax Paid | Tax Assessment Tax Assessment Total Assessment is a certain percentage of the fair market value that is determined by local assessors to be the total taxable value of land and additions on the property. | Land | Improvement |
|---|---|---|---|---|
| 2025 | $2,185 | $215,295 | $73,772 | $141,523 |
| 2024 | $2,185 | $229,649 | $73,772 | $155,877 |
| 2023 | $2,185 | $214,421 | $53,015 | $161,406 |
| 2022 | $4,820 | $200,615 | $40,673 | $159,942 |
| 2021 | $4,634 | $164,845 | $40,673 | $124,172 |
| 2020 | $4,523 | $154,679 | $29,453 | $125,226 |
| 2019 | $4,258 | $146,394 | $20,960 | $125,434 |
| 2018 | $1,119 | $133,911 | $20,960 | $112,951 |
| 2017 | $3,531 | $127,686 | $20,960 | $106,726 |
| 2016 | $3,210 | $114,980 | $20,960 | $94,020 |
| 2015 | $2,124 | $100,430 | $13,895 | $86,535 |
| 2014 | $2,124 | $87,663 | $8,714 | $78,949 |
Source: Public Records
Map
Nearby Homes
- 13219 Vista Brook Dr
- 13215 Vista Oro Dr
- 13322 Chaston Dr
- 7530 Lemma Dr
- 13323 Firebrick Dr
- 7402 Burkridge Dr
- 7623 Brookleaf Dr
- 13202 Chasworth Dr
- 7635 Log Cradle Dr
- 7511 Weatherhill Ln
- 13122 Eldridge Chase
- 7315 Weatherhill Ln
- 7607 Wovenwood Ln
- 7315 Millbrae Ln
- 7823 Autumn Hollow Ln
- 13814 Swan Hollow Ln
- 13811 Brannon Field Ln
- 13826 Swan Hollow Ln
- 7618 Mauna Kai Dr
- 7310 Blenheim Palace Ln
- 7414 Brookleaf Dr
- 7406 Brookleaf Dr
- 13219 Fountain Crest Dr
- 13219 Fountaincrest Ct
- 13222 Fountaincrest Ct
- 13234 Firebrick Dr
- 13230 Firebrick Dr
- 13215 Fountaincrest Ct
- 7411 Brookleaf Dr
- 7415 Brookleaf Dr
- 7407 Brookleaf Dr
- 13226 Firebrick Dr
- 13218 Fountaincrest Ct
- 13223 Vista Brook Dr
- 13215 Vista Brook Dr
- 7403 Brookleaf Dr
- 13211 Vista Brook Dr
- 13222 Firebrick Dr
- 13211 Fountaincrest Ct
- 13207 Vista Brook Dr