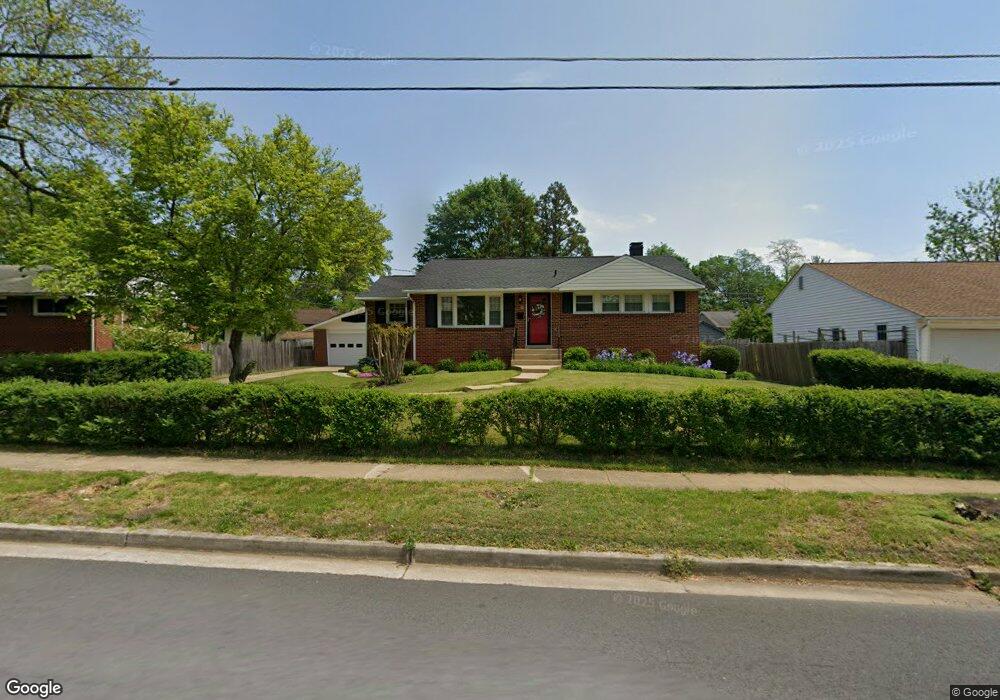
7421 Northrop Rd Alexandria, VA 22306
Estimated Value: $625,000 - $655,000
3
Beds
3
Baths
1,152
Sq Ft
$555/Sq Ft
Est. Value
About This Home
This home is located at 7421 Northrop Rd, Alexandria, VA 22306 and is currently estimated at $639,324, approximately $554 per square foot. 7421 Northrop Rd is a home located in Fairfax County with nearby schools including Hybla Valley Elementary School, Sandburg Middle, and West Potomac High School.
Ownership History
Date
Name
Owned For
Owner Type
Purchase Details
Closed on
Jul 7, 2011
Sold by
Potomac Relocation Services Ll
Bought by
Carlson Patrice C and Fulayter John J
Current Estimated Value
Home Financials for this Owner
Home Financials are based on the most recent Mortgage that was taken out on this home.
Original Mortgage
$174,500
Outstanding Balance
$120,560
Interest Rate
4.6%
Mortgage Type
New Conventional
Estimated Equity
$518,764
Purchase Details
Closed on
Mar 21, 2011
Sold by
Recontrust Company Na and Reveron Rosa Maria
Bought by
Potomac Relocation Services
Purchase Details
Closed on
Mar 11, 2003
Sold by
Revron Luis
Bought by
Reveron Rosa
Purchase Details
Closed on
Jul 25, 1997
Sold by
Kennedy James M and Kennedy Darlene S
Bought by
Reveron Luis and Reveron Rosa Maria
Home Financials for this Owner
Home Financials are based on the most recent Mortgage that was taken out on this home.
Original Mortgage
$167,450
Interest Rate
7.7%
Mortgage Type
New Conventional
Create a Home Valuation Report for This Property
The Home Valuation Report is an in-depth analysis detailing your home's value as well as a comparison with similar homes in the area
Home Values in the Area
Average Home Value in this Area
Purchase History
| Date | Buyer | Sale Price | Title Company |
|---|---|---|---|
| Carlson Patrice C | $349,000 | -- | |
| Potomac Relocation Services | $270,000 | -- | |
| Reveron Rosa | -- | -- | |
| Reveron Luis | $163,000 | -- |
Source: Public Records
Mortgage History
| Date | Status | Borrower | Loan Amount |
|---|---|---|---|
| Open | Carlson Patrice C | $174,500 | |
| Previous Owner | Reveron Luis | $167,450 |
Source: Public Records
Tax History Compared to Growth
Tax History
| Year | Tax Paid | Tax Assessment Tax Assessment Total Assessment is a certain percentage of the fair market value that is determined by local assessors to be the total taxable value of land and additions on the property. | Land | Improvement |
|---|---|---|---|---|
| 2025 | $6,752 | $646,980 | $259,000 | $387,980 |
| 2024 | $6,752 | $582,860 | $234,000 | $348,860 |
| 2023 | $6,314 | $559,490 | $224,000 | $335,490 |
| 2022 | $5,998 | $524,510 | $209,000 | $315,510 |
| 2021 | $5,772 | $491,890 | $179,000 | $312,890 |
| 2020 | $5,264 | $444,740 | $157,000 | $287,740 |
| 2019 | $4,788 | $404,580 | $143,000 | $261,580 |
| 2018 | $4,653 | $404,580 | $143,000 | $261,580 |
| 2017 | $4,573 | $393,920 | $143,000 | $250,920 |
| 2016 | $4,433 | $382,610 | $139,000 | $243,610 |
| 2015 | $4,270 | $382,610 | $139,000 | $243,610 |
| 2014 | $4,195 | $376,720 | $139,000 | $237,720 |
Source: Public Records
Map
Nearby Homes
- 7309 Piper Ct
- 7528C Coxton Ct Unit 99
- 7503G Calderon Ct Unit G 235
- 7525C Snowpea Ct Unit 87
- 7522 Snowpea Ct Unit 24
- 7515 Snowpea Ct Unit 167-L
- 7518B Snowpea Ct Unit 38
- 7334 Tavenner Ln Unit 1-A
- 7355 Mountaineer Dr
- 7282 Nittany Ln
- 7275 Nittany Ln
- 3401 Blue Mallard Landing
- 7589 Grey Goose Way
- 7684 Audubon Meadow Way
- 7207 Mountaineer Dr
- 7203 Mountaineer Dr
- 3335 Beechcliff Dr
- 2808 Boswell Ave
- 7141 Mason Grove Ct Unit 18
- 7508 Milway Dr
- 7423 Northrop Rd
- 7419 Northrop Rd
- 7412 Fordson Rd
- 7414 Fordson Rd
- 7410 Fordson Rd
- 7422 Northrop Rd
- 7420 Northrop Rd
- 7417 Northrop Rd
- 7424 Northrop Rd
- 7416 Fordson Rd
- 7408 Fordson Rd
- 7427 Northrop Rd
- 7426 Northrop Rd
- 7416 Northrop Rd
- 7415 Northrop Rd
- 0 Unit-145 Unit 145 FX7201402
- 0 Huntley Run Unit-139 Place Unit 139 FX7167830
- 0 Unit-145 Unit 145 1008975014
- 0 Huntley Run Unit-139 Place Unit 139 1008941886
- 7418 Fordson Rd