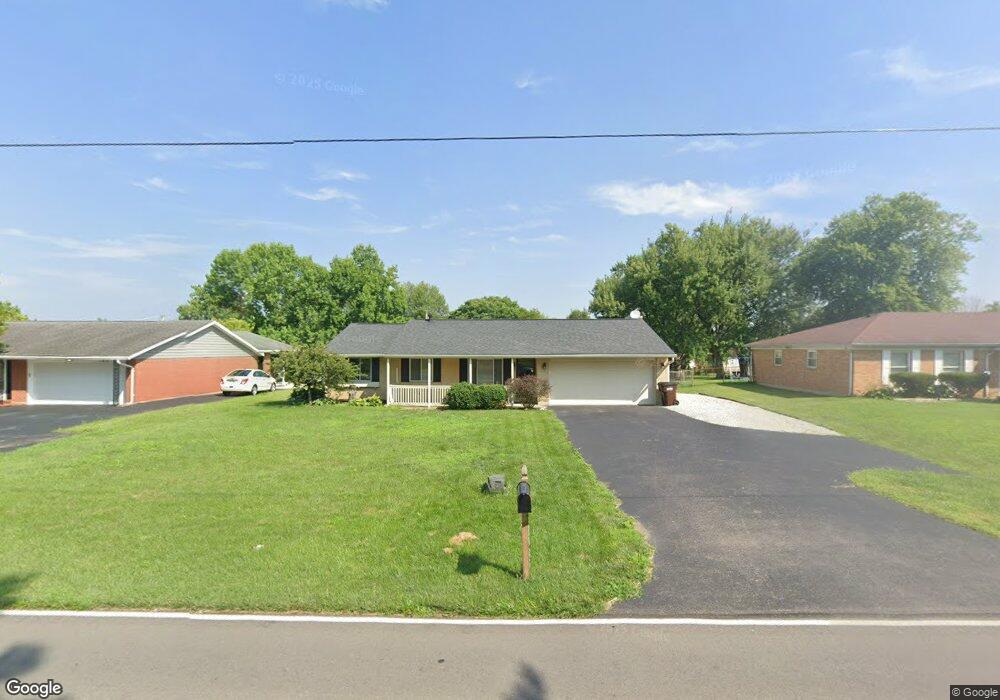
7422 Mad River Rd Dayton, OH 45459
Woodbourne-Hyde Park NeighborhoodEstimated Value: $239,000 - $255,000
3
Beds
2
Baths
1,255
Sq Ft
$196/Sq Ft
Est. Value
About This Home
This home is located at 7422 Mad River Rd, Dayton, OH 45459 and is currently estimated at $246,225, approximately $196 per square foot. 7422 Mad River Rd is a home located in Montgomery County with nearby schools including Miamisburg High School, Bishop Leibold School, and The Miami Valley School.
Ownership History
Date
Name
Owned For
Owner Type
Purchase Details
Closed on
Feb 5, 2022
Sold by
Frantz Devin L
Bought by
Calhoun Jordan and Osorio Loreto Ojeda
Current Estimated Value
Home Financials for this Owner
Home Financials are based on the most recent Mortgage that was taken out on this home.
Original Mortgage
$202,042
Outstanding Balance
$187,611
Interest Rate
3.55%
Mortgage Type
VA
Estimated Equity
$58,614
Purchase Details
Closed on
May 29, 2014
Sold by
Richardson Matthew H and Richardson Theresa M
Bought by
Frantz Devin L
Home Financials for this Owner
Home Financials are based on the most recent Mortgage that was taken out on this home.
Original Mortgage
$112,993
Interest Rate
3.37%
Mortgage Type
FHA
Purchase Details
Closed on
Sep 30, 1999
Sold by
Perrine Herbert E Trustee
Bought by
Richardson Matthew H and Richardson Theresa M
Home Financials for this Owner
Home Financials are based on the most recent Mortgage that was taken out on this home.
Original Mortgage
$87,150
Interest Rate
7.9%
Mortgage Type
FHA
Create a Home Valuation Report for This Property
The Home Valuation Report is an in-depth analysis detailing your home's value as well as a comparison with similar homes in the area
Home Values in the Area
Average Home Value in this Area
Purchase History
| Date | Buyer | Sale Price | Title Company |
|---|---|---|---|
| Calhoun Jordan | -- | Chicago Title | |
| Frantz Devin L | $129,500 | None Available | |
| Richardson Matthew H | $87,900 | -- |
Source: Public Records
Mortgage History
| Date | Status | Borrower | Loan Amount |
|---|---|---|---|
| Open | Calhoun Jordan | $202,042 | |
| Previous Owner | Frantz Devin L | $112,993 | |
| Previous Owner | Richardson Matthew H | $87,150 |
Source: Public Records
Tax History Compared to Growth
Tax History
| Year | Tax Paid | Tax Assessment Tax Assessment Total Assessment is a certain percentage of the fair market value that is determined by local assessors to be the total taxable value of land and additions on the property. | Land | Improvement |
|---|---|---|---|---|
| 2024 | $4,444 | $63,670 | $12,760 | $50,910 |
| 2023 | $4,444 | $63,670 | $12,760 | $50,910 |
| 2022 | $3,869 | $47,030 | $9,450 | $37,580 |
| 2021 | $3,650 | $47,030 | $9,450 | $37,580 |
| 2020 | $3,587 | $47,030 | $9,450 | $37,580 |
| 2019 | $3,615 | $42,910 | $10,500 | $32,410 |
| 2018 | $3,589 | $42,910 | $10,500 | $32,410 |
| 2017 | $3,568 | $42,910 | $10,500 | $32,410 |
| 2016 | $3,236 | $37,300 | $10,500 | $26,800 |
| 2015 | $3,181 | $37,300 | $10,500 | $26,800 |
| 2014 | $3,181 | $37,300 | $10,500 | $26,800 |
| 2012 | -- | $38,690 | $10,500 | $28,190 |
Source: Public Records
Map
Nearby Homes
- 2207 Southlea Dr
- 2334 Mardell Dr
- 7806 Washington Park Dr
- 1817 Provincetown Rd
- 2560 Delavan Dr
- 488 Crossing Ln
- 550 Crossing Ln
- 1931 Alda Ct
- 7061 Rivendell Cir
- 7055 Rivendell Cir
- 2592 Vienna Estates Dr
- 3091 Simpson Ct
- 3057 Wellington Ln Unit 8264
- Yeats Plan at Chamberlin Crossing
- Turnbull Plan at Chamberlin Crossing
- 3052 Simpson Ct
- 3052 Simpson Ct Unit 8337
- 3091 Simpson Ct Unit 8355
- 488 Crossing Ln
- Remington Plan at Chamberlin Crossing
- 7434 Mad River Rd
- 7412 Mad River Rd
- 7444 Mad River Rd
- 2112 Penbrooke Trail
- 2124 Penbrooke Trail
- 7449 Whitehall Dr
- 7481 Whitehall Dr
- 2167 Dahle Ct
- 7454 Mad River Rd
- 7411 Whitehall Dr
- 2159 Dahle Ct
- 7421 Mad River Rd
- 7437 Mad River Rd
- 7431 Mad River Rd
- 7411 Mad River Rd
- 2151 Dahle Ct
- 7460 Mad River Rd
- 2105 Penbrooke Trail
- 2125 Penbrooke Trail
- 2175 Dahle Ct