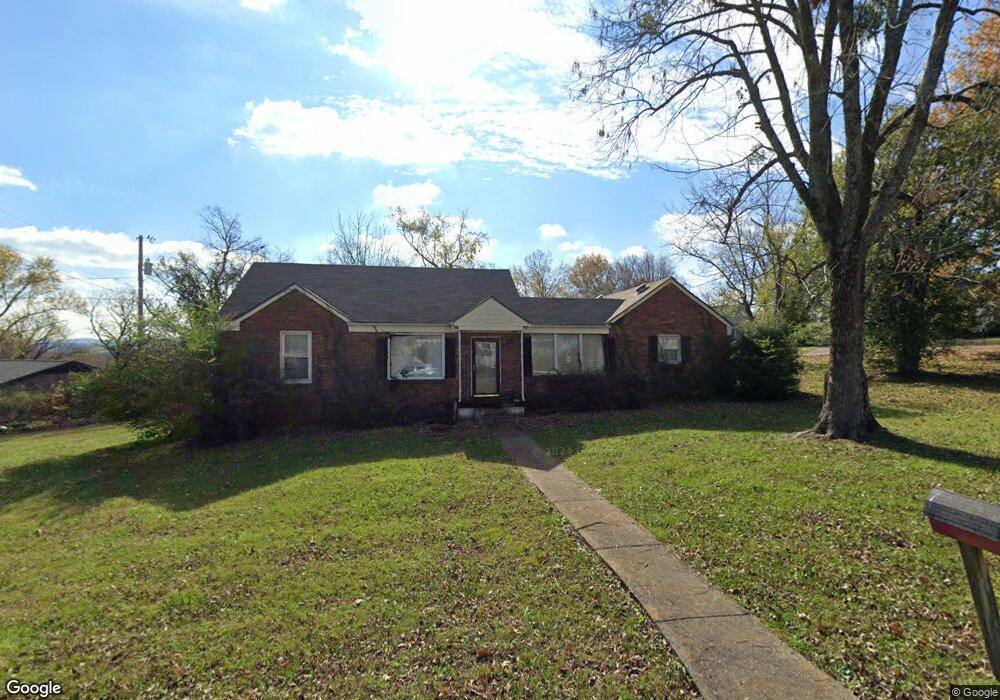
743 Maple St Lewisburg, TN 37091
Estimated Value: $196,000 - $246,000
--
Bed
2
Baths
1,572
Sq Ft
$139/Sq Ft
Est. Value
About This Home
This home is located at 743 Maple St, Lewisburg, TN 37091 and is currently estimated at $218,111, approximately $138 per square foot. 743 Maple St is a home located in Marshall County with nearby schools including Marshall Elementary School, Oak Grove Elementary School, and Westhills Elementary School.
Ownership History
Date
Name
Owned For
Owner Type
Purchase Details
Closed on
Sep 2, 2005
Sold by
William Parrish
Bought by
Joshua Harmon
Current Estimated Value
Home Financials for this Owner
Home Financials are based on the most recent Mortgage that was taken out on this home.
Original Mortgage
$60,000
Outstanding Balance
$35,114
Interest Rate
7.38%
Mortgage Type
Cash
Estimated Equity
$182,997
Purchase Details
Closed on
Aug 31, 2005
Sold by
Carlise Brown Lartoniya
Bought by
Jonathan Angus
Home Financials for this Owner
Home Financials are based on the most recent Mortgage that was taken out on this home.
Original Mortgage
$60,000
Outstanding Balance
$35,114
Interest Rate
7.38%
Mortgage Type
Cash
Estimated Equity
$182,997
Purchase Details
Closed on
Aug 17, 1999
Sold by
Brown Jeffery L
Bought by
Carlise Brown Lartoniya
Purchase Details
Closed on
Apr 21, 1995
Sold by
Fred Shelton William
Bought by
Brown Jeffrey L
Purchase Details
Closed on
Feb 24, 1995
Sold by
Whitehead James M
Bought by
Fred Shelton William
Purchase Details
Closed on
Sep 16, 1991
Bought by
Whitehead James M and Whitehead Susan
Purchase Details
Closed on
Aug 7, 1990
Bought by
Mcadams Mildred W
Create a Home Valuation Report for This Property
The Home Valuation Report is an in-depth analysis detailing your home's value as well as a comparison with similar homes in the area
Home Values in the Area
Average Home Value in this Area
Purchase History
| Date | Buyer | Sale Price | Title Company |
|---|---|---|---|
| Joshua Harmon | $63,500 | -- | |
| Jonathan Angus | $80,000 | -- | |
| Carlise Brown Lartoniya | -- | -- | |
| Brown Jeffrey L | $74,500 | -- | |
| Fred Shelton William | $70,000 | -- | |
| Whitehead James M | $52,500 | -- | |
| Mcadams Mildred W | $59,500 | -- |
Source: Public Records
Mortgage History
| Date | Status | Borrower | Loan Amount |
|---|---|---|---|
| Open | Mcadams Mildred W | $60,000 |
Source: Public Records
Tax History Compared to Growth
Tax History
| Year | Tax Paid | Tax Assessment Tax Assessment Total Assessment is a certain percentage of the fair market value that is determined by local assessors to be the total taxable value of land and additions on the property. | Land | Improvement |
|---|---|---|---|---|
| 2024 | -- | $36,150 | $6,000 | $30,150 |
| 2023 | $1,122 | $36,150 | $6,000 | $30,150 |
| 2022 | $1,122 | $36,150 | $6,000 | $30,150 |
| 2021 | $1,032 | $22,200 | $3,750 | $18,450 |
| 2020 | $1,046 | $22,475 | $3,750 | $18,725 |
| 2019 | $1,012 | $22,475 | $3,750 | $18,725 |
| 2018 | $1,001 | $22,475 | $3,750 | $18,725 |
| 2017 | $1,001 | $22,475 | $3,750 | $18,725 |
| 2016 | $1,078 | $21,050 | $4,000 | $17,050 |
| 2015 | $983 | $21,050 | $4,000 | $17,050 |
| 2014 | $983 | $21,050 | $4,000 | $17,050 |
Source: Public Records
Map
Nearby Homes
- 610 Forrest St
- 525 Maple St
- 518 Maple St
- 215 5th Ave N
- 632 Colburn Dr
- 640 6th Ave S
- 726 Thomas Ave
- 0 New Lake Rd Unit RTC3030964
- 316 Haynes St
- 966 Berry St
- 117 W End Ave N
- 251 Joyce Ave
- 1221 W Commerce St
- 108 W End Ave N
- 240 Joyce Ave
- 1111 W End Ave N
- 0 Joyce Ave
- 416 1st Ave N
- 347 Oakwood Dr
- 718 Midway St