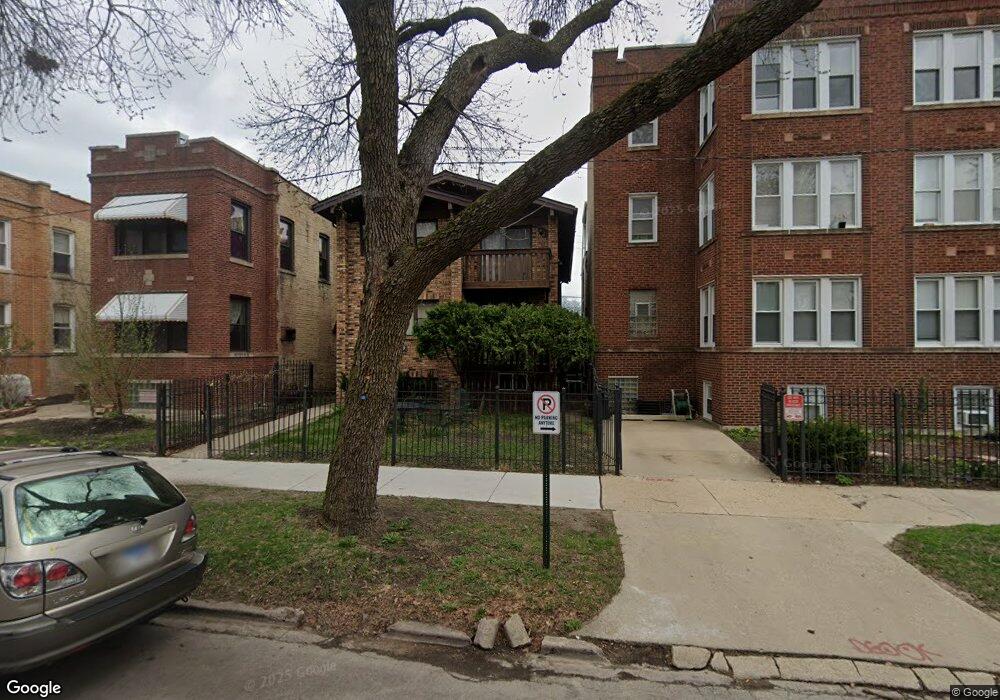
7439 N Artesian Ave Unit W Chicago, IL 60645
West Ridge NeighborhoodEstimated Value: $272,000 - $357,000
3
Beds
2
Baths
1,550
Sq Ft
$190/Sq Ft
Est. Value
About This Home
This home is located at 7439 N Artesian Ave Unit W, Chicago, IL 60645 and is currently estimated at $294,552, approximately $190 per square foot. 7439 N Artesian Ave Unit W is a home located in Cook County with nearby schools including Rogers Elementary School, Mather High School, and Acero - Sor Juana Ines de la Cruz School.
Ownership History
Date
Name
Owned For
Owner Type
Purchase Details
Closed on
Jan 19, 2007
Sold by
Goitom Haimanot
Bought by
Goitom Haimanot and Yohannes Girmai
Current Estimated Value
Purchase Details
Closed on
Sep 2, 2003
Sold by
Mansoor Wardia
Bought by
Goitom Haimanot
Home Financials for this Owner
Home Financials are based on the most recent Mortgage that was taken out on this home.
Original Mortgage
$198,320
Interest Rate
8.99%
Mortgage Type
Unknown
Purchase Details
Closed on
Jun 22, 2001
Sold by
Yusken Anthony W
Bought by
Mansoor Wardia
Purchase Details
Closed on
Oct 14, 1994
Sold by
Buess Robert J and Ackmann Cecilia
Bought by
Yusken Anthony W
Home Financials for this Owner
Home Financials are based on the most recent Mortgage that was taken out on this home.
Original Mortgage
$93,800
Interest Rate
8.53%
Create a Home Valuation Report for This Property
The Home Valuation Report is an in-depth analysis detailing your home's value as well as a comparison with similar homes in the area
Home Values in the Area
Average Home Value in this Area
Purchase History
| Date | Buyer | Sale Price | Title Company |
|---|---|---|---|
| Goitom Haimanot | -- | Select Title | |
| Goitom Haimanot | $248,000 | Pntn | |
| Mansoor Wardia | $189,000 | -- | |
| Yusken Anthony W | $134,000 | -- |
Source: Public Records
Mortgage History
| Date | Status | Borrower | Loan Amount |
|---|---|---|---|
| Previous Owner | Goitom Haimanot | $198,320 | |
| Previous Owner | Yusken Anthony W | $93,800 |
Source: Public Records
Tax History Compared to Growth
Tax History
| Year | Tax Paid | Tax Assessment Tax Assessment Total Assessment is a certain percentage of the fair market value that is determined by local assessors to be the total taxable value of land and additions on the property. | Land | Improvement |
|---|---|---|---|---|
| 2024 | $2,887 | $27,125 | $4,760 | $22,365 |
| 2023 | $2,793 | $17,000 | $3,808 | $13,192 |
| 2022 | $2,793 | $17,000 | $3,808 | $13,192 |
| 2021 | $2,749 | $17,000 | $3,808 | $13,192 |
| 2020 | $3,737 | $19,877 | $2,760 | $17,117 |
| 2019 | $3,742 | $22,053 | $2,760 | $19,293 |
| 2018 | $3,678 | $22,053 | $2,760 | $19,293 |
| 2017 | $3,268 | $18,556 | $2,475 | $16,081 |
| 2016 | $3,216 | $18,556 | $2,475 | $16,081 |
| 2015 | $2,920 | $18,556 | $2,475 | $16,081 |
| 2014 | $2,100 | $13,889 | $2,284 | $11,605 |
| 2013 | $2,048 | $13,889 | $2,284 | $11,605 |
Source: Public Records
Map
Nearby Homes
- 2522 W Jarvis Ave
- 2256 W Birchwood Ave
- 7546 N Oakley Ave
- 7249 N Campbell Ave Unit B
- 7315 N Oakley Ave Unit 1A
- 1200 Dobson St
- 7348 N Ridge Blvd Unit 16B
- 7344 N Ridge Blvd Unit 5C
- 7252 N Bell Ave
- 7223 N Oakley Ave Unit 1E
- 1406 Brummel St
- 7433 N Washtenaw Ave
- 7540 N Ridge Blvd Unit 5C
- 7540 N Ridge Blvd Unit 5D
- 1615 W Howard St Unit 303
- 2224 W Touhy Ave Unit 3N
- 7234 N Hamilton Ave
- 7129 N Oakley Ave
- 2109 W Jarvis Ave Unit 1
- 2175 W Touhy Ave
- 7439 N Artesian Ave Unit 1
- 7439 N Artesian Ave Unit E
- 7439 N Artesian Ave Unit 2
- 7443 N Artesian Ave
- 2422 W Fargo Ave Unit 1
- 2422 W Fargo Ave Unit 2
- 2424 W Fargo Ave Unit 2
- 2424 W Fargo Ave Unit 3
- 2424 W Fargo Ave Unit 1
- 7435 N Artesian Ave
- 2416 W Fargo Ave Unit 2
- 2416 W Fargo Ave Unit 1
- 2416 W Fargo Ave Unit 3
- 2414 W Fargo Ave Unit 3
- 7445 N Artesian Ave Unit 1
- 7447 N Artesian Ave
- 7438 N Artesian Ave Unit 3
- 7438 N Artesian Ave Unit 1
- 7438 N Artesian Ave
- 7438 N Artesian Ave Unit 2