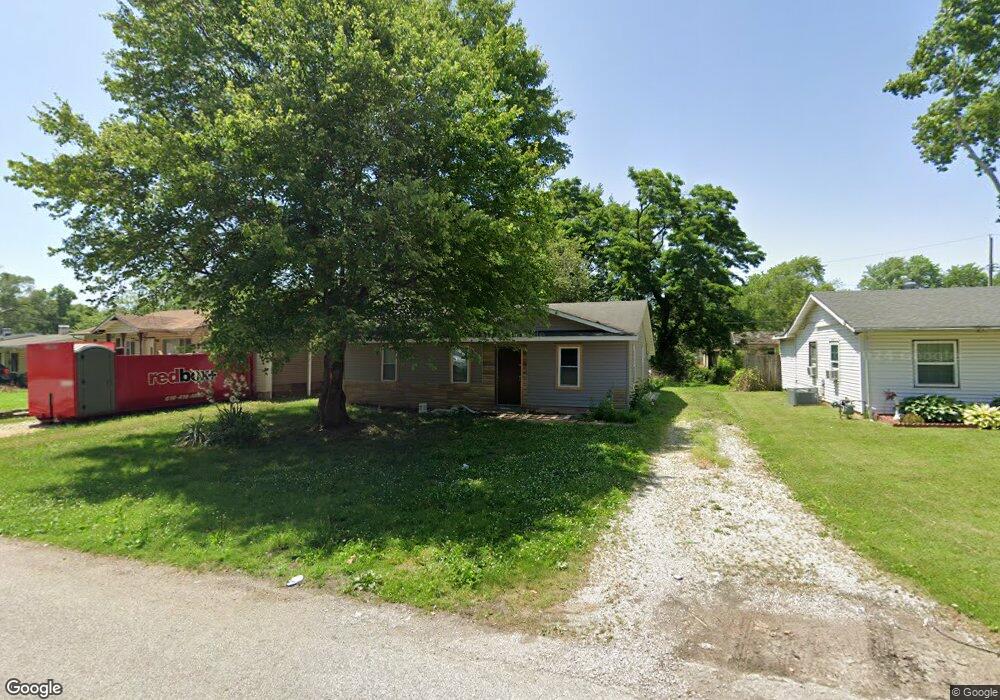
744 Saint Nicholas Dr East Saint Louis, IL 62206
Estimated Value: $73,000 - $97,000
3
Beds
1
Bath
912
Sq Ft
$93/Sq Ft
Est. Value
About This Home
This home is located at 744 Saint Nicholas Dr, East Saint Louis, IL 62206 and is currently estimated at $84,941, approximately $93 per square foot. 744 Saint Nicholas Dr is a home located in St. Clair County.
Ownership History
Date
Name
Owned For
Owner Type
Purchase Details
Closed on
Oct 12, 2022
Sold by
Hyp Llc
Bought by
Wilson Zipporah
Current Estimated Value
Home Financials for this Owner
Home Financials are based on the most recent Mortgage that was taken out on this home.
Original Mortgage
$60,000
Outstanding Balance
$57,916
Interest Rate
6.5%
Mortgage Type
New Conventional
Estimated Equity
$27,025
Purchase Details
Closed on
Dec 3, 2013
Sold by
Stillwater Corporation
Bought by
Six Hands Investments Llc
Purchase Details
Closed on
Aug 8, 2007
Sold by
Still Waters Corp
Bought by
Stillwater Corp
Home Financials for this Owner
Home Financials are based on the most recent Mortgage that was taken out on this home.
Original Mortgage
$183,750
Interest Rate
6.71%
Mortgage Type
Purchase Money Mortgage
Purchase Details
Closed on
Nov 21, 2002
Sold by
West Pointe Bank & Trust Company
Bought by
Still Waters Corp
Create a Home Valuation Report for This Property
The Home Valuation Report is an in-depth analysis detailing your home's value as well as a comparison with similar homes in the area
Home Values in the Area
Average Home Value in this Area
Purchase History
| Date | Buyer | Sale Price | Title Company |
|---|---|---|---|
| Wilson Zipporah | $75,000 | Accent Title | |
| Hyp Llc | $58,500 | Accent Title | |
| Six Hands Investments Llc | $51,000 | Accent Title Inc | |
| Stillwater Corp | -- | First County Title | |
| Still Waters Corp | -- | First County Title |
Source: Public Records
Mortgage History
| Date | Status | Borrower | Loan Amount |
|---|---|---|---|
| Open | Wilson Zipporah | $60,000 | |
| Previous Owner | Stillwater Corp | $183,750 |
Source: Public Records
Tax History Compared to Growth
Tax History
| Year | Tax Paid | Tax Assessment Tax Assessment Total Assessment is a certain percentage of the fair market value that is determined by local assessors to be the total taxable value of land and additions on the property. | Land | Improvement |
|---|---|---|---|---|
| 2024 | $1,617 | $8,500 | $1,057 | $7,443 |
| 2023 | $1,460 | $7,682 | $955 | $6,727 |
| 2022 | $1,336 | $6,733 | $837 | $5,896 |
| 2021 | $1,370 | $6,380 | $793 | $5,587 |
| 2020 | $1,020 | $4,376 | $831 | $3,545 |
| 2019 | $1,021 | $4,376 | $831 | $3,545 |
| 2018 | $1,016 | $4,440 | $843 | $3,597 |
| 2017 | $1,024 | $4,333 | $823 | $3,510 |
| 2016 | $1,088 | $4,435 | $819 | $3,616 |
| 2014 | $897 | $4,387 | $810 | $3,577 |
| 2013 | $2,123 | $4,115 | $760 | $3,355 |
Source: Public Records
Map
Nearby Homes
- 803 Saint Thomas Ln
- 804 Saint Thomas Ln
- 808 Saint Thomas Ln
- 120 Saint Leo Dr
- 810 Saint Thomas Ln
- 725 Saint Nicholas Dr
- 125 Saint Leo Dr
- 111 Saint Leo Dr
- 116 Saint Barbara Ln
- 114 Saint Barbara Ln
- 510 Saint Paul Dr
- 310 E 5th St
- 525 Saint Leo Dr
- 603 Saint Nicholas Dr
- 528 Saint Paul Dr
- 706 Saint Barbara Ln
- 227 Donald St
- 721 Saint Barbara Ln
- 209 W 6th St
- 747 Saint Norbert Dr
- 742 St Nicholas
- 746 Saint Nicholas Dr
- 740 Saint Nicholas Dr
- 748 Saint Nicholas Dr
- 138 Saint Robert Dr
- 136 Saint Robert Dr
- 140 Saint Robert Dr
- 134 Saint Robert Dr
- 743 Saint Nicholas Dr
- 745 Saint Nicholas Dr
- 738 Saint Nicholas Dr
- 703 Saint Thomas Ln
- 741 Saint Nicholas Dr
- 750 Saint Nicholas Dr
- 747 Saint Nicholas Dr
- 132 Saint Robert Dr
- 749 Saint Nicholas Dr
- 736 Saint Nicholas Dr
- 751 Saint Nicholas Dr
- 739 Saint Nicholas Dr