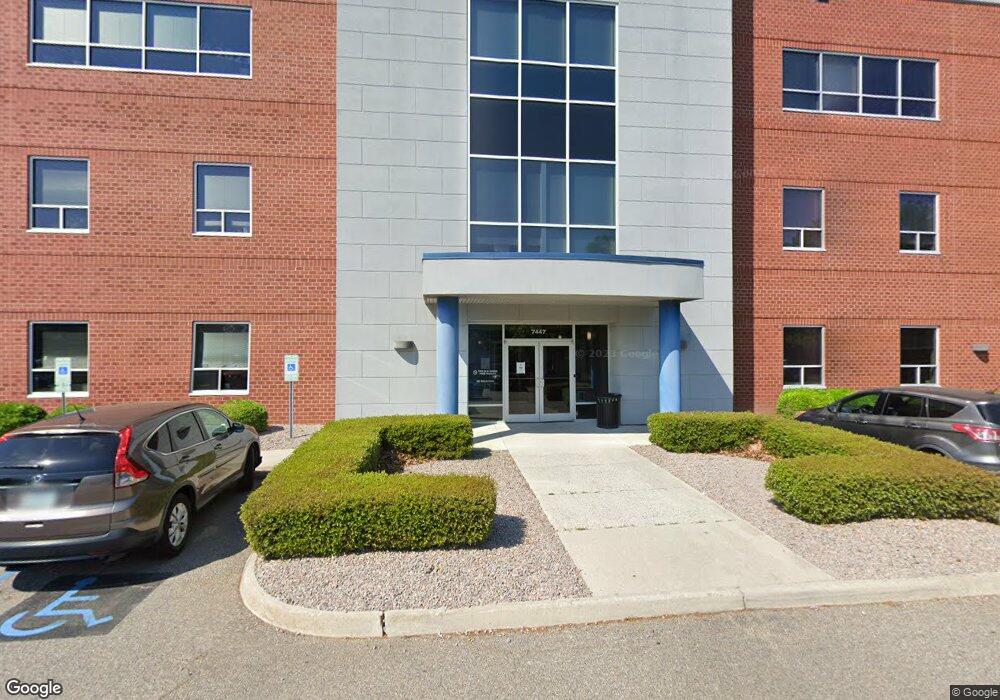
7447 Central Business Park Dr Norfolk, VA 23513
Colonial Heights NeighborhoodEstimated Value: $7,063,170
--
Bed
--
Bath
53,400
Sq Ft
$132/Sq Ft
Est. Value
About This Home
This home is located at 7447 Central Business Park Dr, Norfolk, VA 23513 and is currently estimated at $7,063,170, approximately $132 per square foot. 7447 Central Business Park Dr is a home located in Norfolk City with nearby schools including Suburban Park Elementary School, Norview Middle School, and Norview High School.
Ownership History
Date
Name
Owned For
Owner Type
Purchase Details
Closed on
Jul 30, 2018
Sold by
Rref Ii Sb-Va Thnc Llc
Bought by
The City Of Norfolk
Current Estimated Value
Purchase Details
Closed on
Dec 18, 2015
Sold by
Reo Solutions Llc A Virginia Limited Lia
Bought by
Rref Ii Sb-Va Thnc Llc A Virginia Bankin
Purchase Details
Closed on
Sep 22, 2005
Sold by
Economic Development Authority Of The Ci
Bought by
Norfolk Central Development Llc
Home Financials for this Owner
Home Financials are based on the most recent Mortgage that was taken out on this home.
Original Mortgage
$517,500
Interest Rate
6.34%
Mortgage Type
Credit Line Revolving
Create a Home Valuation Report for This Property
The Home Valuation Report is an in-depth analysis detailing your home's value as well as a comparison with similar homes in the area
Home Values in the Area
Average Home Value in this Area
Purchase History
| Date | Buyer | Sale Price | Title Company |
|---|---|---|---|
| The City Of Norfolk | $4,500,000 | Bridgetrust Title Group | |
| Rref Ii Sb-Va Thnc Llc A Virginia Bankin | $2,500,000 | None Available | |
| Norfolk Central Development Llc | $325,795 | -- |
Source: Public Records
Mortgage History
| Date | Status | Borrower | Loan Amount |
|---|---|---|---|
| Previous Owner | Norfolk Central Development Llc | $517,500 |
Source: Public Records
Tax History Compared to Growth
Tax History
| Year | Tax Paid | Tax Assessment Tax Assessment Total Assessment is a certain percentage of the fair market value that is determined by local assessors to be the total taxable value of land and additions on the property. | Land | Improvement |
|---|---|---|---|---|
| 2025 | $106,346 | $8,507,700 | $637,500 | $7,870,200 |
| 2024 | $100,646 | $8,051,700 | $637,500 | $7,414,200 |
| 2023 | $97,241 | $7,779,300 | $637,500 | $7,141,800 |
| 2022 | $92,243 | $7,379,400 | $510,000 | $6,869,400 |
| 2021 | $0 | $6,559,100 | $510,000 | $6,049,100 |
| 2020 | $0 | $4,886,200 | $510,000 | $4,376,200 |
| 2019 | $15,269 | $4,886,200 | $510,000 | $4,376,200 |
| 2018 | $61,078 | $4,886,200 | $510,000 | $4,376,200 |
| 2017 | $55,558 | $4,831,100 | $510,000 | $4,321,100 |
| 2016 | $55,558 | $4,811,800 | $510,000 | $4,301,800 |
| 2015 | $52,899 | $4,811,800 | $510,000 | $4,301,800 |
| 2014 | $52,899 | $4,811,800 | $510,000 | $4,301,800 |
Source: Public Records
Map
Nearby Homes
- 7446 Tyndale Ct
- 7446 Davidson St
- 720 Nickoles Ln
- 935 Avenue I
- 809 Craten Rd
- 7945 Merritt St
- 741 Bancker Rd
- 977 Avenue G
- 711 Easy St
- 8034 Old Ocean View Rd
- 8045 Westcliff Dr
- 8013 Ardmore Rd
- 8050 Merritt St
- 551 Ashlawn Dr
- 517 Biltmore Rd
- 901 Lasser Dr
- 7021 University Dr
- 538 Draper Dr
- 817 Burksdale Rd
- 1044 Kane St
- 7437 Central Business Park Dr
- 7506 Avenue J
- 7512 Avenue J
- 7511 Avenue J
- 900 Asbury Ave
- 7460 Central Business Park Dr
- 7516 Avenue J
- 7440 Central Business Park Dr
- 7658 Central Business Park Dr
- 7519 Avenue J
- 7520 Avenue J
- 7523 Avenue J
- 7625 Sewells Point Rd
- 7533 Sewells Point Rd
- 7613 Sewells Point Rd
- 7420 Central Business Park Dr
- 7421 Central Business Park Dr
- 7553 Sewells Point Rd
- 7527 Avenue J
- 901 Asbury Ave