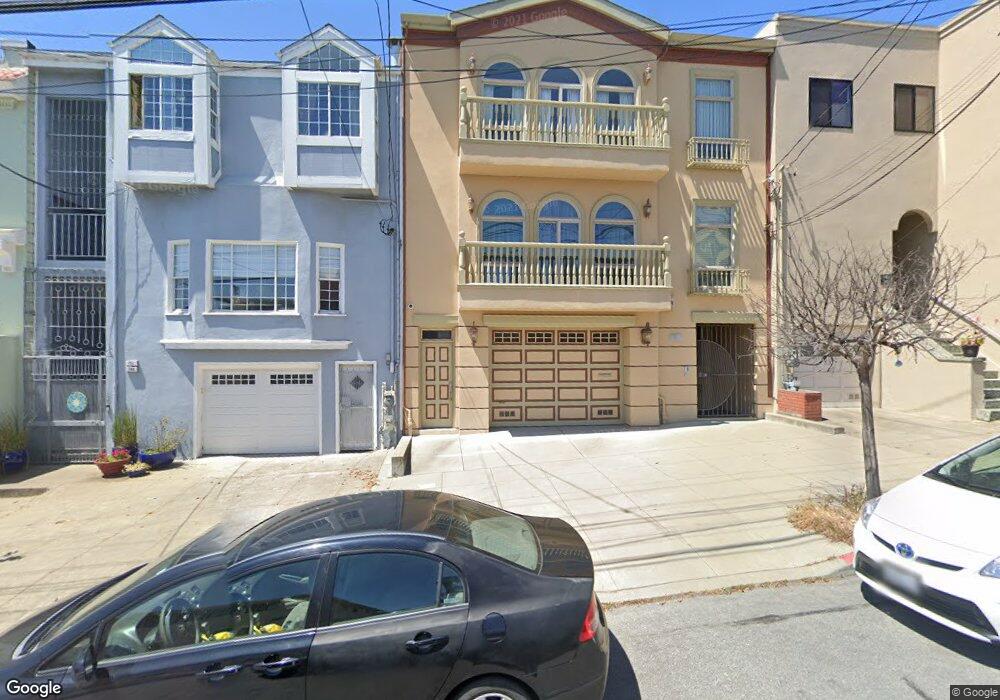
745 26th Ave Unit 747 San Francisco, CA 94121
Central Richmond NeighborhoodEstimated Value: $2,581,000 - $3,382,752
4
Beds
5
Baths
5,478
Sq Ft
$545/Sq Ft
Est. Value
About This Home
This home is located at 745 26th Ave Unit 747, San Francisco, CA 94121 and is currently estimated at $2,985,688, approximately $545 per square foot. 745 26th Ave Unit 747 is a home located in San Francisco County with nearby schools including Argonne Elementary School, Presidio Middle School, and St. John Of San Francisco Orthodox Acade.
Ownership History
Date
Name
Owned For
Owner Type
Purchase Details
Closed on
Oct 3, 2007
Sold by
Sui Michael K and Sui Carol A
Bought by
Sui Michael K and Sui Carol A
Current Estimated Value
Purchase Details
Closed on
Jun 25, 2007
Sold by
Liang Guo Chao and Liang Al Chang
Bought by
Sui Michael K and Sui Carol A
Home Financials for this Owner
Home Financials are based on the most recent Mortgage that was taken out on this home.
Original Mortgage
$1,482,600
Interest Rate
6.25%
Mortgage Type
Commercial
Purchase Details
Closed on
Jun 9, 2003
Sold by
Fong Tony K and Fong Margaret Moy
Bought by
Fong Tony K and Fong Margaret Moy
Purchase Details
Closed on
Oct 1, 1999
Sold by
Cacdac Migida T Revocable Tr and Joseph
Bought by
Liang Guo Chao and Liang Al Chang
Home Financials for this Owner
Home Financials are based on the most recent Mortgage that was taken out on this home.
Original Mortgage
$317,460
Interest Rate
3.85%
Mortgage Type
Commercial
Create a Home Valuation Report for This Property
The Home Valuation Report is an in-depth analysis detailing your home's value as well as a comparison with similar homes in the area
Home Values in the Area
Average Home Value in this Area
Purchase History
| Date | Buyer | Sale Price | Title Company |
|---|---|---|---|
| Sui Michael K | -- | None Available | |
| Sui Michael K | $2,118,000 | Alliance Title Company | |
| Fong Tony K | -- | -- | |
| Liang Guo Chao | $423,500 | Old Republic Title Company |
Source: Public Records
Mortgage History
| Date | Status | Borrower | Loan Amount |
|---|---|---|---|
| Previous Owner | Sui Michael K | $1,482,600 | |
| Previous Owner | Liang Guo Chao | $317,460 |
Source: Public Records
Tax History Compared to Growth
Tax History
| Year | Tax Paid | Tax Assessment Tax Assessment Total Assessment is a certain percentage of the fair market value that is determined by local assessors to be the total taxable value of land and additions on the property. | Land | Improvement |
|---|---|---|---|---|
| 2025 | $20,892 | $2,133,281 | $1,283,055 | $850,226 |
| 2024 | $20,892 | $1,779,145 | $1,072,368 | $706,777 |
| 2023 | $20,591 | $1,744,261 | $1,051,342 | $692,919 |
| 2022 | $20,223 | $1,710,062 | $1,030,728 | $679,334 |
| 2021 | $19,873 | $1,676,534 | $1,010,519 | $666,015 |
| 2020 | $19,983 | $1,659,344 | $1,000,158 | $659,186 |
| 2019 | $19,246 | $1,626,810 | $980,548 | $646,262 |
| 2018 | $18,597 | $1,594,913 | $961,322 | $633,591 |
| 2017 | $18,378 | $1,563,643 | $942,474 | $621,169 |
| 2016 | $18,091 | $1,532,985 | $923,995 | $608,990 |
| 2015 | $17,871 | $1,509,959 | $910,116 | $599,843 |
| 2014 | $17,398 | $1,480,382 | $892,289 | $588,093 |
Source: Public Records
Map
Nearby Homes
- 874 27th Ave
- 880 26th Ave Unit 5
- 880 26th Ave Unit 2
- 880 26th Ave
- 647 24th Ave
- 714 23rd Ave
- 576 27th Ave
- 574 26th Ave Unit 3
- 519 22nd Ave
- 765 21st Ave
- 5600 Fulton St
- 668 33rd Ave
- 2725 Clement St
- 375 25th Ave Unit 401
- 5924 Fulton St
- 439 32nd Ave
- 1633 Cabrillo St
- 1608 Balboa St
- 7039 Geary Blvd
- 1545-1547 Balboa St