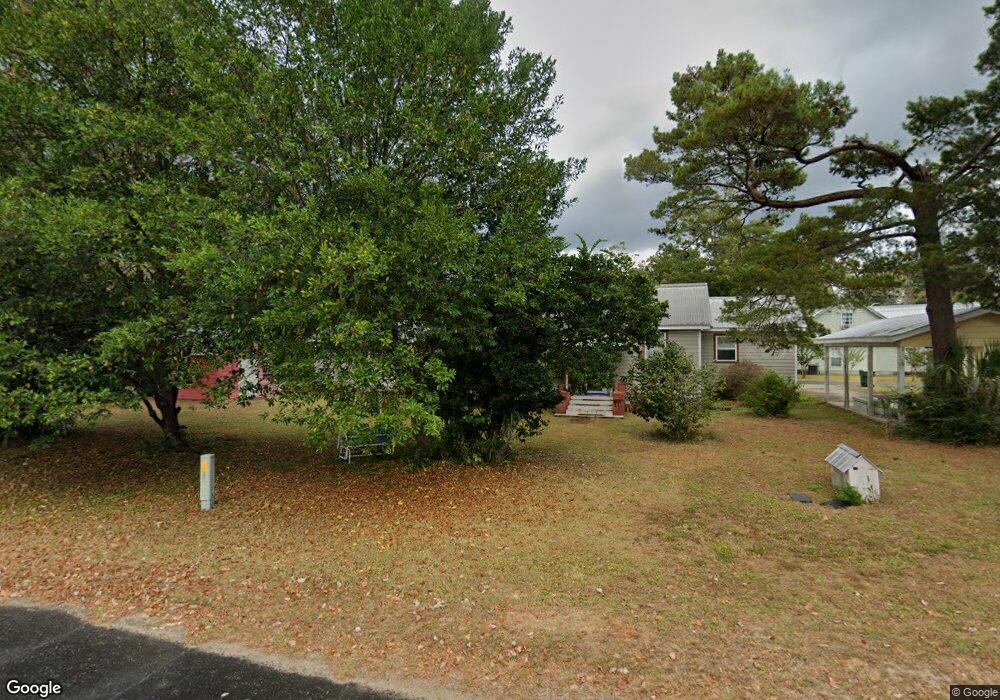
75 Clay St Defuniak Springs, FL 32435
Estimated Value: $340,000 - $476,000
4
Beds
3
Baths
2,383
Sq Ft
$168/Sq Ft
Est. Value
About This Home
This home is located at 75 Clay St, Defuniak Springs, FL 32435 and is currently estimated at $401,485, approximately $168 per square foot. 75 Clay St is a home located in Walton County with nearby schools including West Defuniak Elementary School, Maude Saunders Elementary School, and Walton Middle School.
Ownership History
Date
Name
Owned For
Owner Type
Purchase Details
Closed on
Oct 31, 2012
Sold by
Powell Bonnie L
Bought by
Thomas Richard M and Richard Nelson Thomas Revocable Trust
Current Estimated Value
Purchase Details
Closed on
Feb 17, 2010
Sold by
Clarke Rosemary T
Bought by
Powell Bonnie L
Purchase Details
Closed on
Apr 11, 2008
Sold by
Powell Leroy C and Powell Bonnie L
Bought by
Leroy & Bonnie Powell Joint Living Trust
Purchase Details
Closed on
Jan 17, 2008
Sold by
Powell Jeffrey Scott and Powell Jennifer L
Bought by
Powell Leroy C and Powell Bonnie L
Purchase Details
Closed on
May 9, 2007
Sold by
Putman Julie L and Powell Leroy C
Bought by
Powell Jeffrey Scott and Powell Bonnie L
Purchase Details
Closed on
Oct 19, 2005
Sold by
Powell Leroy C and Powell Bonnie
Bought by
Clarke George W and Clarke Rosemary T
Purchase Details
Closed on
Jan 29, 2004
Sold by
Martin Lindsey I and Martin Carole A
Bought by
Powell Leroy C and Powell Bonnie L
Create a Home Valuation Report for This Property
The Home Valuation Report is an in-depth analysis detailing your home's value as well as a comparison with similar homes in the area
Home Values in the Area
Average Home Value in this Area
Purchase History
| Date | Buyer | Sale Price | Title Company |
|---|---|---|---|
| Thomas Richard M | $135,000 | Mitchell Land & Title Inc | |
| Powell Bonnie L | -- | None Available | |
| Leroy & Bonnie Powell Joint Living Trust | -- | None Available | |
| Powell Leroy C | -- | None Available | |
| Powell Jeffrey Scott | -- | None Available | |
| Clarke George W | -- | -- | |
| Powell Leroy C | $50,000 | -- |
Source: Public Records
Tax History Compared to Growth
Tax History
| Year | Tax Paid | Tax Assessment Tax Assessment Total Assessment is a certain percentage of the fair market value that is determined by local assessors to be the total taxable value of land and additions on the property. | Land | Improvement |
|---|---|---|---|---|
| 2024 | $3,974 | $362,283 | $25,000 | $337,283 |
| 2023 | $3,974 | $250,038 | $0 | $0 |
| 2022 | $3,561 | $337,049 | $34,416 | $302,633 |
| 2021 | $2,883 | $206,643 | $17,952 | $188,691 |
| 2020 | $2,730 | $198,643 | $15,047 | $183,596 |
| 2019 | $2,475 | $195,921 | $14,049 | $181,872 |
| 2018 | $2,196 | $165,943 | $0 | $0 |
| 2017 | $2,211 | $166,625 | $13,381 | $153,244 |
| 2016 | $2,182 | $163,279 | $0 | $0 |
| 2015 | $2,160 | $159,747 | $0 | $0 |
| 2014 | $2,183 | $159,747 | $0 | $0 |
Source: Public Records
Map
Nearby Homes
- 290 Crescent Dr
- 152 Leconte St
- 388 S 11th St
- 270 S 12th St
- X Lot S 13th St
- 122 Bruce Ave
- 72 Park Ave
- 64 Live Oak Ave W
- 4319 Us Highway 331
- 13.7 AC Us Highway 331
- 99 Florida 83
- 126 N 11th St
- 87 Bay Ave
- 111 Bay Ave
- 3 Lots N 11th St Unit LOTS 715,716 & 717
- Lot 27 Us Highway 331
- 15 Acres Corbett Dr
- 97 Walnut Ave
- 226 S 19th St
- 316 S 19th St